Price Channels
Charting and Technical Analysis
Charting and Technical Analysis: This pattern can form when the market is in an uptrend or downtrend but in both cases, prices remain in a channel as the market advances or declines. It is a pattern that can produce many trading opportunities.
In order for a bullish price channel to form the market needs to form a low followed by at least one subsequent higher low. The lows are connected with a line (the trendline) which provides support to the market. Traders look for the market to rally when the market hits this trendline.
The market also needs to make at least two highs that, when connected with a line, is parallel to the main trendline. Traders look for the market to decline when it hits the upper channel line. Some analysts may draw an upper line parallel to the main trendline after it forms in anticipation that it may develop into a price channel.
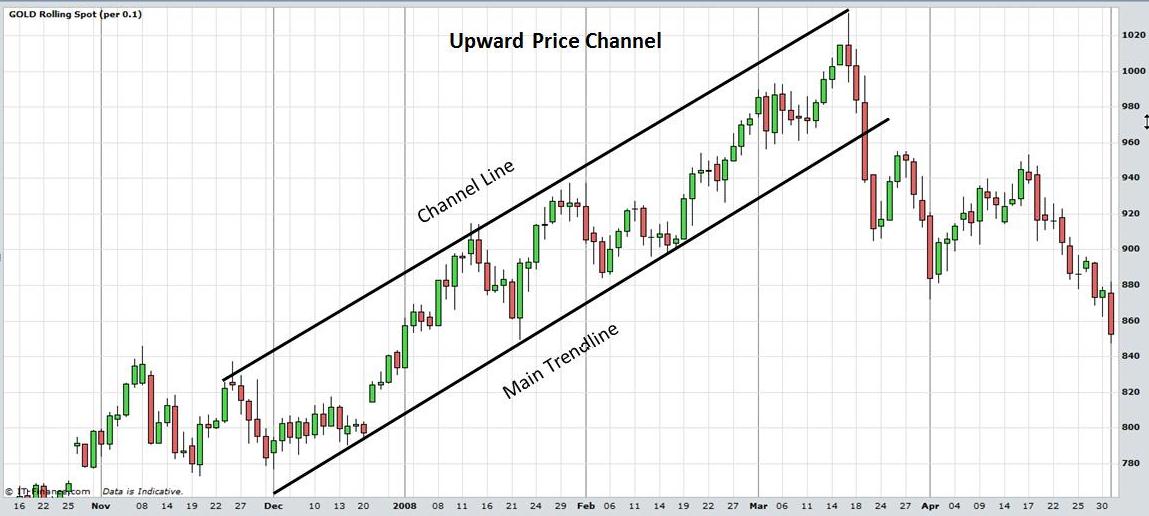
Examine the chart of Gold below which is an example of a bullish or upward price channel.
- The Gold market is in a price channel from December 2007 to March 2008.
- When traders see the price channel forming they may buy or go long when the market hits support at the main trendline and sell or go short when prices reach resistance at the upper channel line.
- All trends come to an end and an indication of a trend ending is when the market fails to rally to the upper line or more importantly breaks below the support line.
- Often, this can lead to a sharp decline as occurred when Gold broke through the support line on 19th March 2008.
Charting and Technical Analysis - Price Channels. View charts in interactive mode at ProRealTime.com.
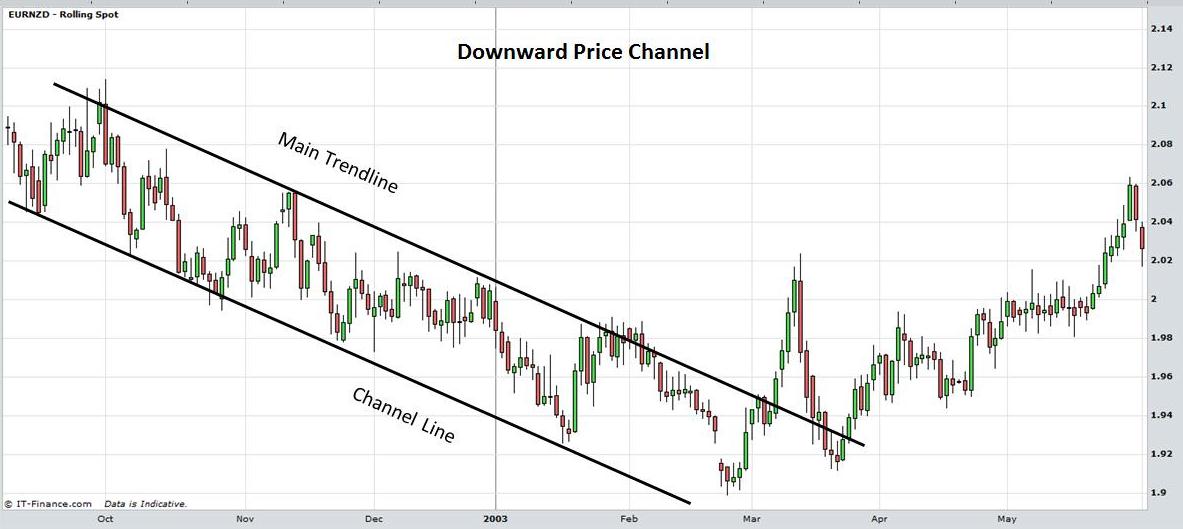
A bearish or downward sloping price channel is similar to the bullish one, of course, except that the trend is downwards.
- Examine the next chart of EUR/NZD which formed between September 2002 and February 2003.
- The main trendline connects the highs while the lower channel line connects the lows.
- This time traders may sell or go short as the market reaches the upper line and buy or go long when it declines to the lower/support line.
- When the market makes a significant break of the main trendline on 7th and 8th March it’s a strong indication that the price channel has broken and the trend is changing.
Charting and Technical Analysis - Price Channels.
Don’t look for perfection. The market may not react exactly at the support or resistance lines every time. Sometimes prices may shoot higher or lower on an intra-day basis but close on or near the line. If you look closely at the chart you will see examples of this. The market may even close for a day or two above or below the line before returning to the price channel. Keep the bigger picture and the main trend in mind while implementing appropriate risk management and stop loss strategies.
Return to Top of Charting and Technical Analysis: Price Channels
Return to Technical Analysis Charts Page