Rounding Tops and Bottoms
Commodity Forex Online Trading
CommodityForex Online Trading - Rounding Tops and Bottoms: When markets make a long term top or bottom it often forms in the shape of a V or double/triple bottom due to the volatility that occurs at major turning points. Less common are rounding tops and bottoms which tend to form over weeks, months or years.
- At the top it looks like the upper half of a semi-circle.
- The initial advance to the top should tend towards symmetry in price and time with the subsequent decline.
- This means that if the market advances 1000 points in 20 weeks then the other half of pattern should be approximately a 1000 point decline in 20 weeks.
- Don’t look for perfection. It’s acceptable if it takes a bit longer or shorter to complete the decline as long as the market tracks the rounding/semi-circular pattern.
- Higher volume on the decline can be a confirming bearish indicator as buying interest decreases and selling pressure rises.
- To confirm the rounding top the market should break the initial reaction that started the advance to the top.
Examine the chart of USD/JPY currency pair below for a practical example.
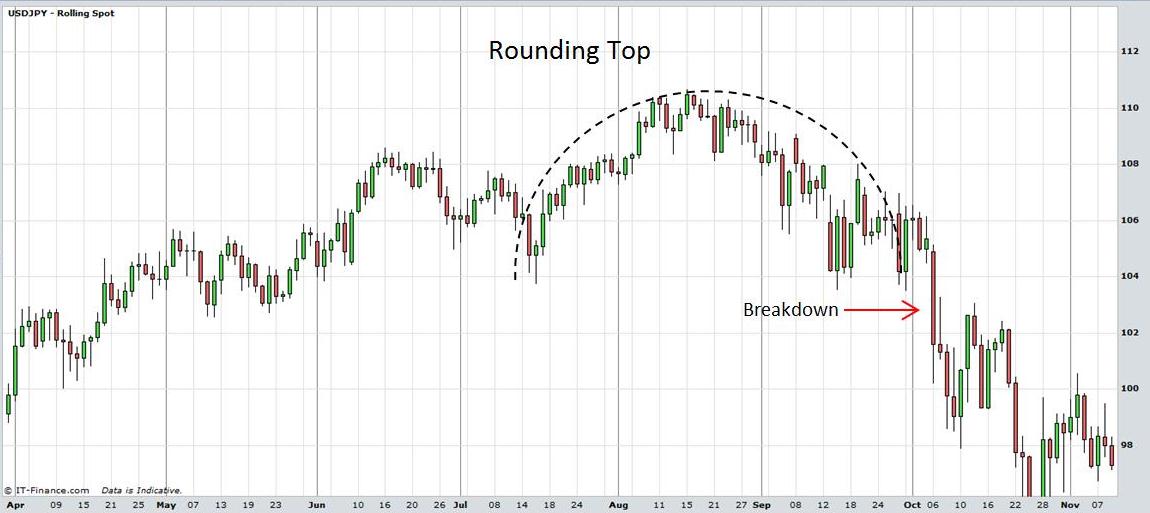
Rounding Top: View charts in interactive mode at ProRealTime.com.
- A rounding bottom looks like the lower half of a semi-circle.
- The initial decline to the bottom should tend towards symmetry in price and time with the subsequent advance.
- Higher volume on the advance can be a confirming bullish indicator as selling pressure decreases and buying pressure increases.
- To confirm the rounding top the market should break the initial point of decline at the beginning of the pattern.
Examine the chart of AUD/USD currency pair below for a practical example.
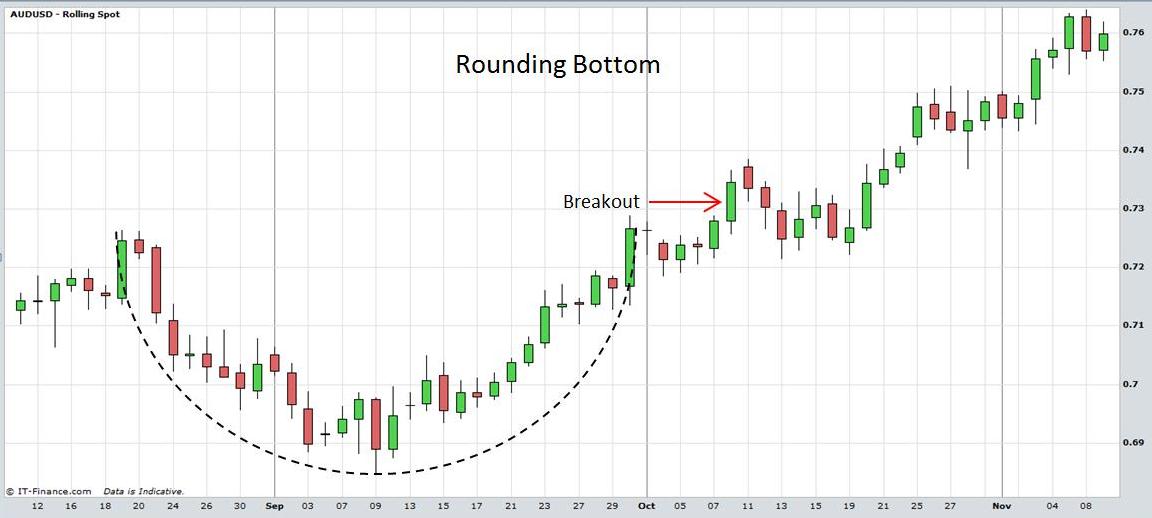
Rounding Bottom
Rounding Tops and Bottoms can manifest in Stocks, Exchange Traded Funds, Forex,
Commodities, Bonds, Futures, etc. Traders should always implement appropriate risk management and stop loss strategies.
Return to Top of Commodity Forex Online Trading: Rounding Top
Return to Technical Analysis Charts Page