Forex Trading Technical Analysis
Price Oscillator
Forex Trading Technical Analysis: Price Oscillator displays the difference of two moving averages in either points or percentages. It is calculated by subtracting a short moving average by a long one. In its percentage form, the result is divided by the short moving average and multiplied by 100.
It can be used to determine overbought and oversold conditions although not as well as the RSI or Stochastic because unlike those indicators it is not bounded by upper and lower bands. It tends to work better in a trending market and can be used to confirm bullish or bearish price moves. Study the daily candlestick the chart of the EUR/USD currency pair below. The Price Oscillator is set on a 12 and 26 day moving average. The moving averages have been placed on the chart and notice that when the shorter moving average crosses the slower moving average, the Price Oscillator crosses the 0 line. Traders often interpret this as a buy signal. Similarly when the shorter moving average crosses below the slower moving average the oscillator crosses below the 0 line. In an uptrend traders may buy when the Price Oscillator crosses above the 0 line and sell when it crosses below again. In keeping with the philosophy that it is best to trade with the trend many traders would exit their long position rather than entering a new short position. They may re-enter a long position again when the indicator crosses above the 0 line.
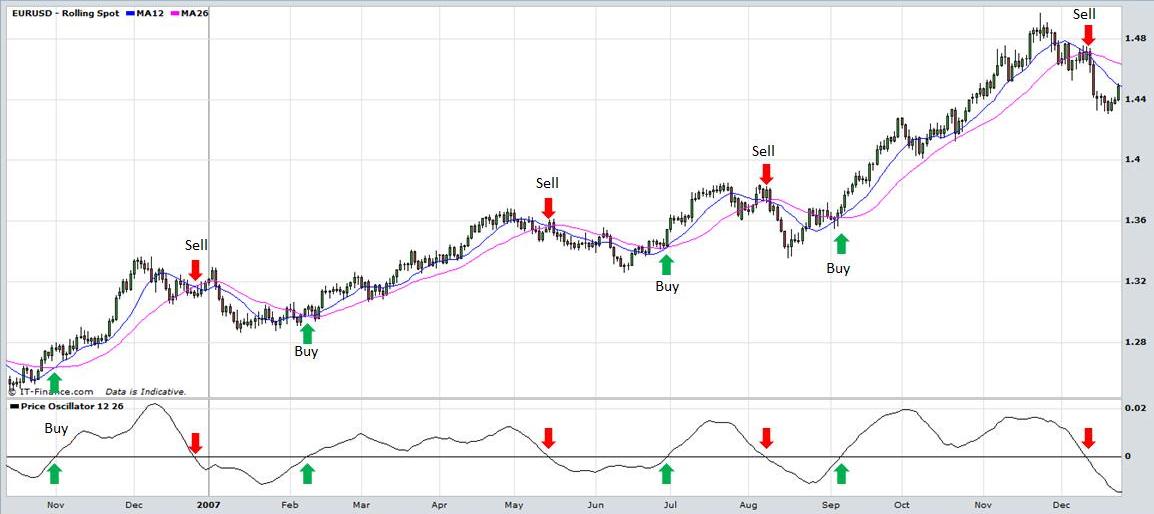
View charts in interactive mode at ProRealTime.com.
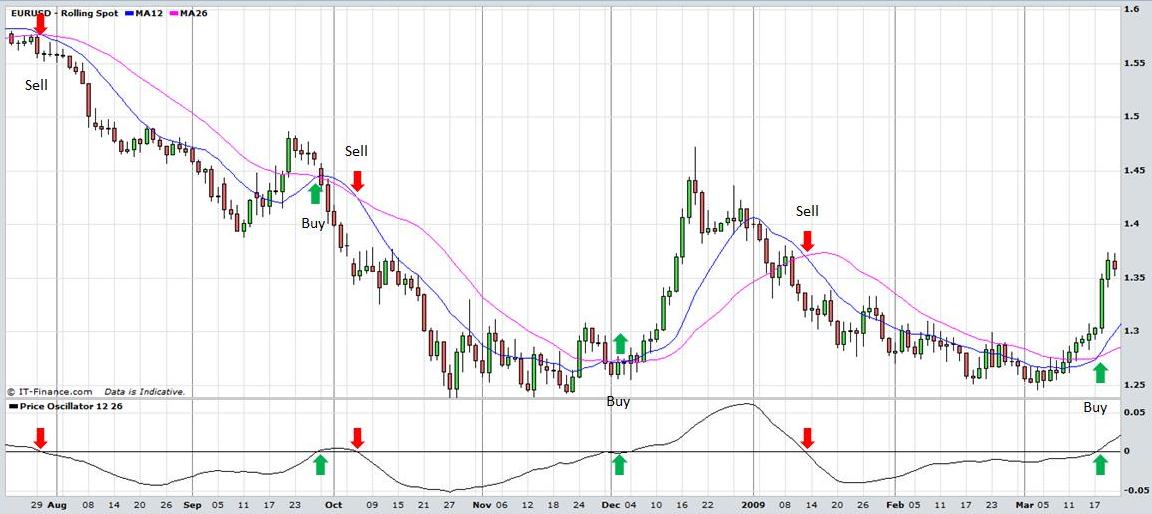
A similar strategy can be adopted in a market that is trending downwards. In this scenario, traders may enter a short position when the oscillator crosses below the 0 line and exit the position when it crosses back above it.
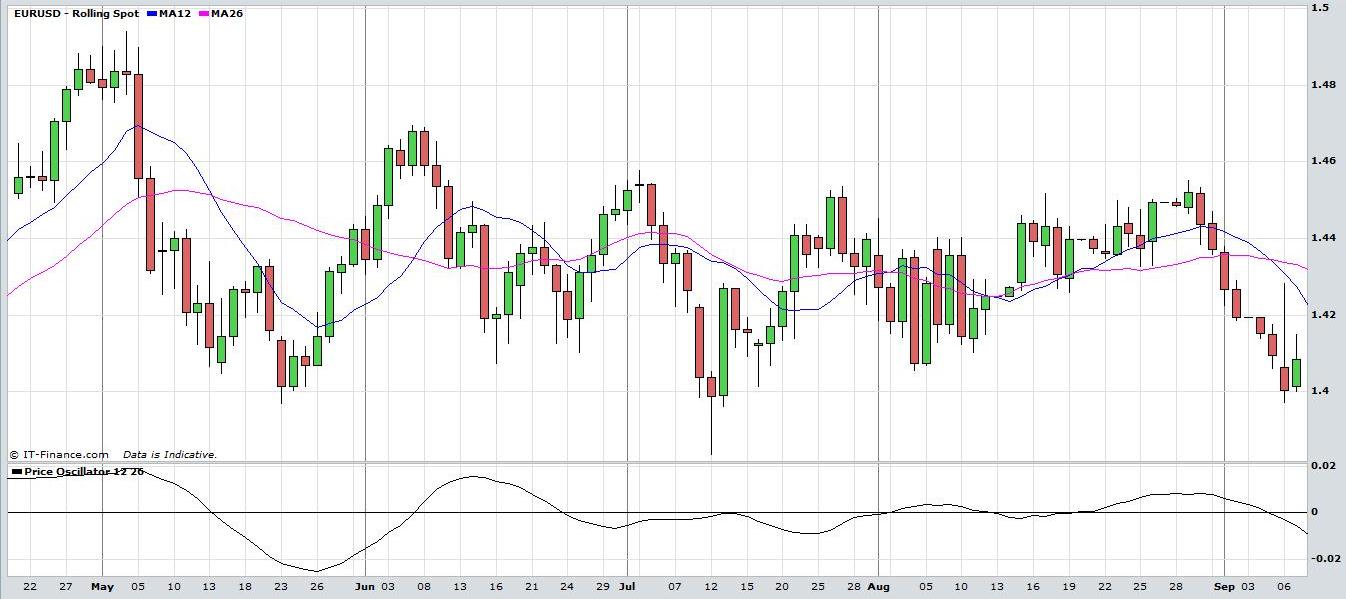
The Price Oscillator doesn’t work so well in a range trading market. Examine the chart of the EUR/USD below. See how the Price Oscillator crosses over the 0 line numerous times because the market is choppy. It gives too many buy and sell signals may result in many trades being stopped out at a loss.
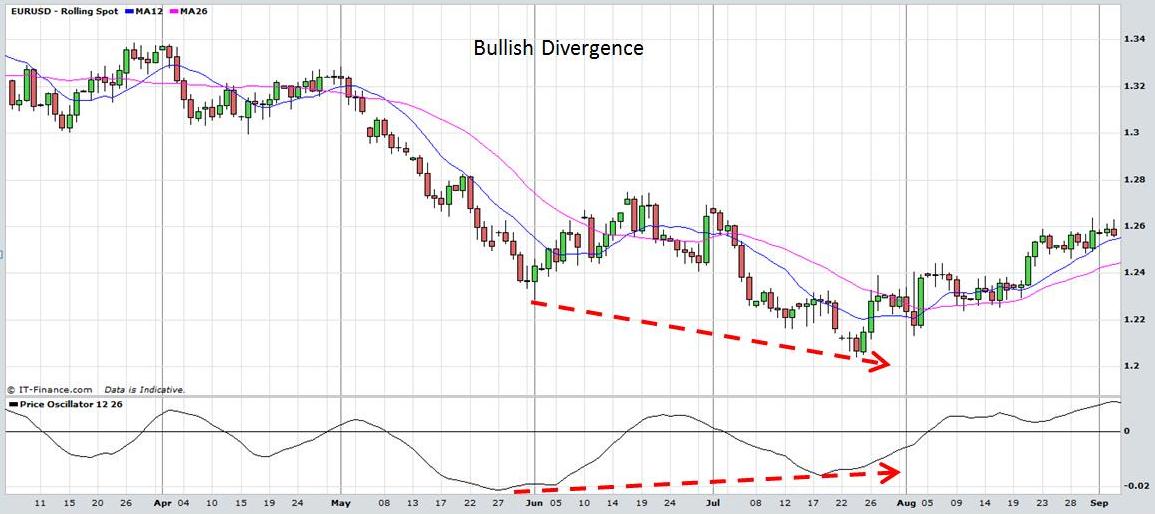
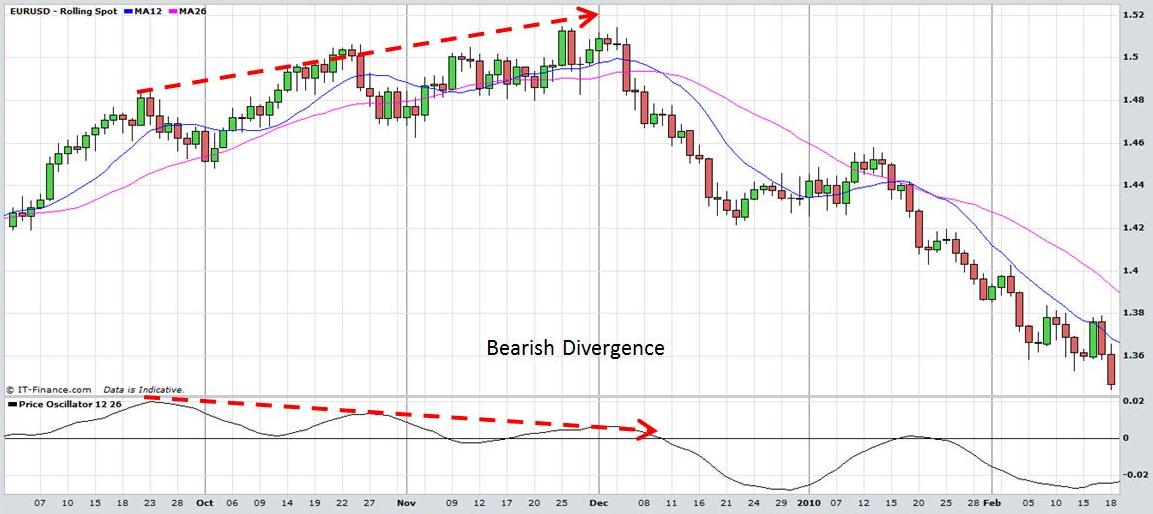
Divergences in oscillators can also indicate buy and sell signals. When prices make a new high but the oscillator does not, it can indicate that momentum is running out although prices are rising. This is known as bearish divergence and is interpreted by some traders as a buy signal. Similarly when prices decline to new lows but the oscillator does not, it can indicate that momentum may be decreasing despite the fact that prices are declining further. This is known as bullish divergence and may be interpreted as a buy signal. The charts below demonstrate this action.
Forex Trading Technical Analysis: Price Oscillator
Forex Trading Technical Analysis: Price Oscillator
The Price Oscillator can be used in trading Stocks, Exchange Traded Funds, Forex, Commodities, Bonds, Futures, etc. Traders should always implement appropriate risk management and stop loss strategies.
Return to Forex Trading Technical Analysis: Price Oscillator