Online Trading Investing
Price Rate of Change
Online Trading Investing: Price Rate of Change (ROC) is a momentum indicator. It measures the percentage change in price between the current period and a set number of periods in the past. The number of periods can be altered by the user.
The calculation for price rate of change is:
[(Close - Close n periods ago) / (Close n periods ago)] * 100
The indicator is plotted in the form of an oscillator that fluctuates above and below a zero line. Typically a rising ROC is accompanied by rising prices and a declining ROC by falling prices. Moves above the zero line are considered positive while below the zero line are negative. It is also used to alert traders to possible overbought and oversold conditions. Some traders use it to identify bullish and bearish divergence.
ROC can help to identify buying opportunities in an uptrend and selling opportunities in a downtrend. During an uptrend prices make higher highs, and higher lows. Many traders wait for a retracement in prices before buying, in anticipation that the trend will resume its path upwards. As the oscillator declines into oversold territory it can be interpreted as a signal to buy. It is advisable to use this indicator with a couple of other technical analysis indicators or chart patterns such as moving averages, Fibonacci Retracements, ZigZag or Measured Moves. The same process can be used in a downtrend.
Study the daily candlestick chart of Microsoft below. It shows the share price in a sustained ten month rally. Notice how that the oscillator often dipped below the zero line when the market retraced. Buying each time the oscillator turned up when it was below the zero line would have been immensely profitable over that period. Traders could use a trailing stop loss strategy to keep them in their positions for the duration of the trend. In fact, it wasn’t until January 2010 that the market experienced its first significant pullback in prices.
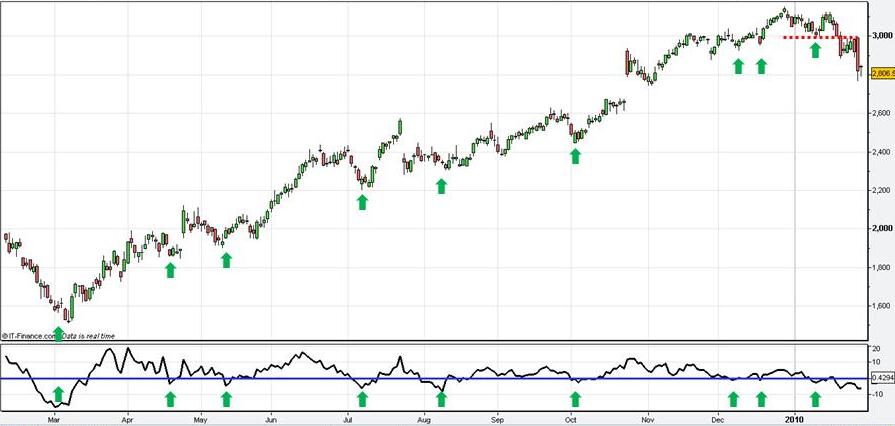
Online Trading Investing: Price Rate Of Change
A similar strategy can be implemented during a downtrend. For example, the chart below shows the EURUSD in a sustained decline. Market rallies were typically accompanied by a move of the 12 period ROC above the zero line. Traders may decide to go short each time the oscillator turned down after tracking above the zero line. In June, a trader adopting this strategy would have gone short as the oscillator moved above the zero line before beginning to decline again. However, prices continued to rally higher. This demonstrates how traders must implement effective risk management and stop loss strategies. As the trend turned from down to up, traders could change their strategy to buying on the dips again as indicated by the green arrows.
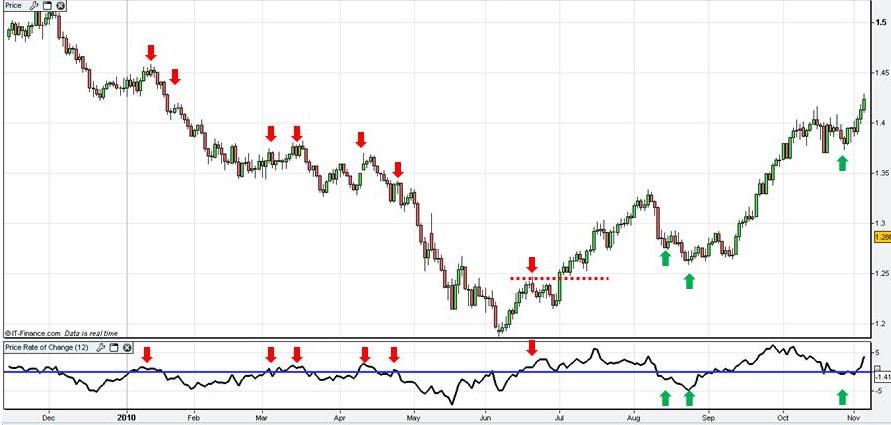
View charts in interactive mode at ProRealTime.com. Online Trading Investing: Price Rate Of Change
Another way of using ROC is to identify overbought or oversold conditions when the market is in congestion. Look at the chart of Nike below which shows Nike meeting resistance just above $66 and support just under $62. Traders would be on the alert to buy at support and sell at resistance. The ROC could be used as a confirmation indicator. Often when the ROC crossed the 5% line it was also close to the resistance level and signalled a selling opportunity. Similarly at the -5% line the market was near established support levels signalling a potential buying opportunity. The challenge in trading a sideways market with ROC is finding the correct number of periods to use and the level which indicates overbought and oversold. Only when you find the right settings will it be useful.
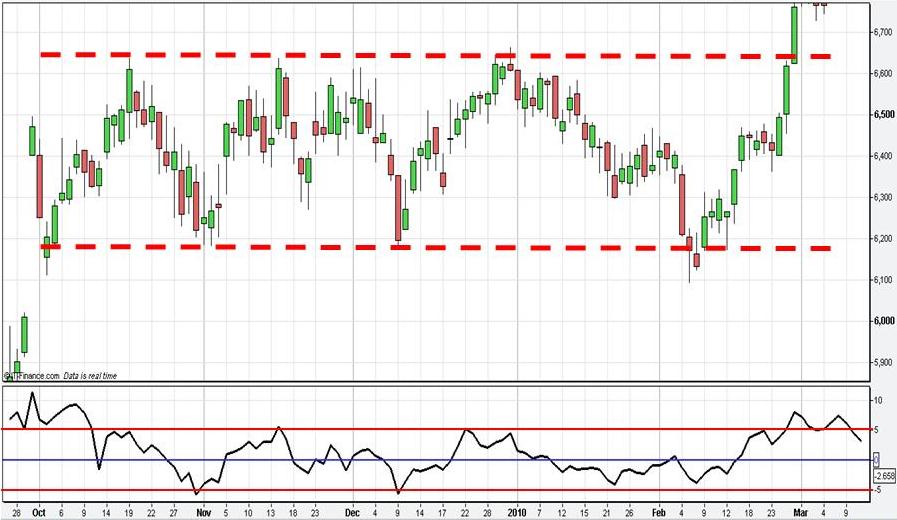
Online Trading Investing: Price Rate Of Change
Some traders also look for bullish and bearish divergences between the ROC and price action. Bearish divergence is when prices continue to rise but the ROC is in decline. See the chart of the USDCHF currency pair below for an example. Traders may see this as a sign that upward momentum is declining even though prices are continuing to rise.
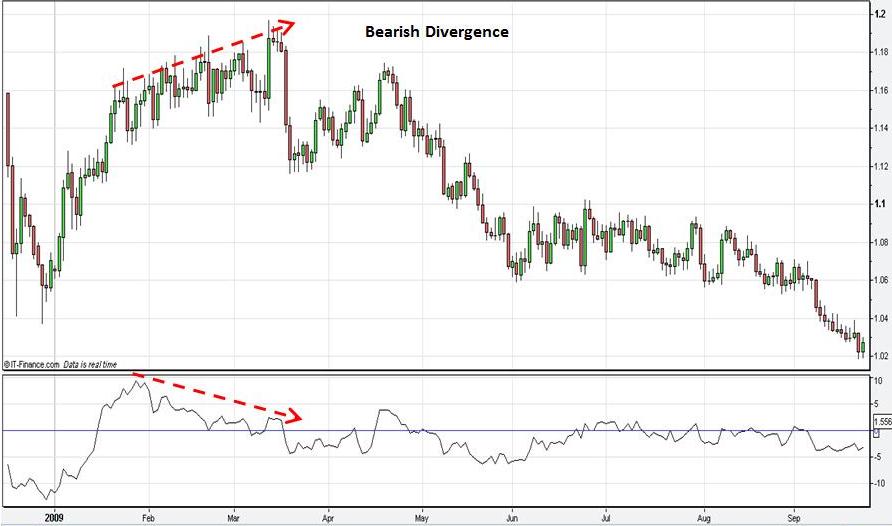
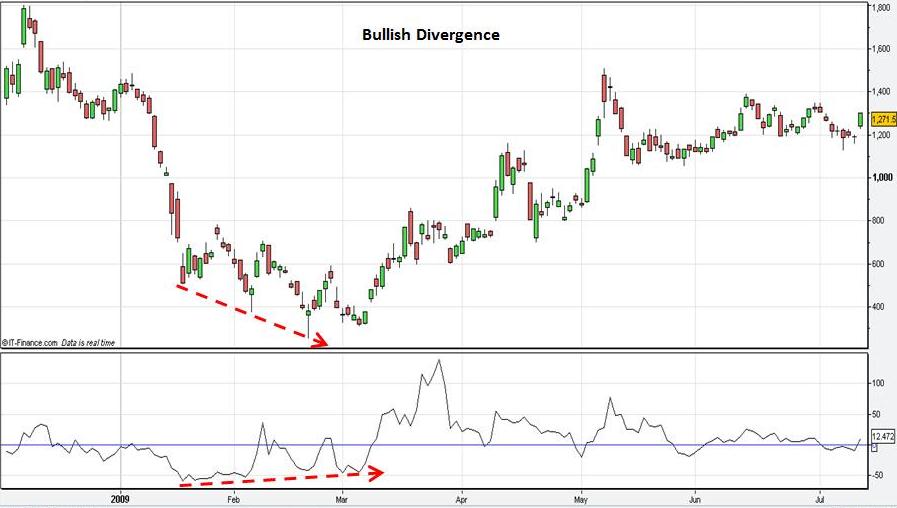
Bullish divergence occurs when prices are declining to new lows but the ROC is rising. Again, some see this as a sign that downward momentum is becoming exhausted because the indicator is beginning to rise despite falling prices.
As with all technical
indicators, ROC provides no guarantees. Traders need to adopt appropriate risk
management techniques. Typically traders use a number of indicators in
combination with chart patterns that suit their trading strategy. ROC is
available on most charting software and can be applied in trading Stocks, Exchange Traded Funds, Futures, Forex,
Commodities, Bonds, etc.
Return to Top of Online Trading Investing: Price Rate of Change