Support
Stock Market Chart
A stock market chart is useful in identifiying areas of
price support in a companies share price. The concept of support is an important one in
trading financial markets. Technical analysts will use charts to identify
support levels in Stocks, Exchange Traded Funds, Forex,
Commodities, Bonds, Futures, etc. Support refers to
a price level at which a financial security regularly finds buyers. Traders may
buy or go long at a recognised support level in anticipation that the market will rise in
price simply because it has already proven that buyers have bought there before.
Support levels can be identified in any time frame whether that be on an
intra-day, daily, weekly or monthly chart. Remember, if you’re waiting for the
market to turn on the exact price it has indicated support at before, you may
be disappointed. Markets can become quite volatile at these levels so traders
need to allow for some wiggle room to allow for the price fluctation.
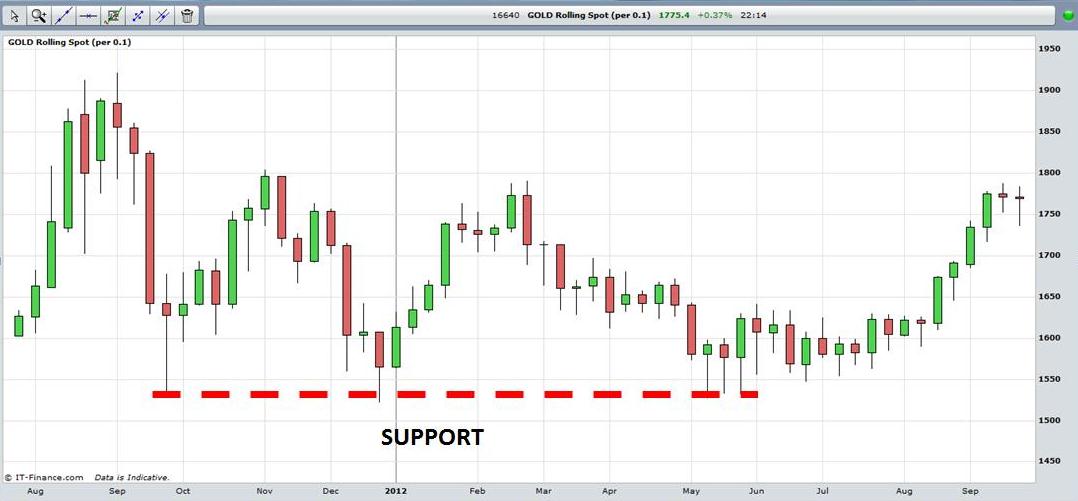
The accompanying chart is a weekly candlestick chart of gold. This chart shows how gold made a major top in early September 2011. This was followed by a rapid decline to the 1533 level by late September. The market rallied strongly to early November before declining again to bottom around the 1522 level before commencing another rally until the end of February 2012.
At this stage a trader sees that the Gold market has twice found support around the same level. If it declines to this level again some traders will use this as a buying opportunity. As you can see gold did decline to the 1527 level in mid-May before commencing a strong rally.
The concept of support worked well in this example.
However, be aware that if a market breaks through an important support level it
can lead to rapidly lower prices. As always, a trader should be prepared for a
possible breakdown in price and implement an effective risk management and stop loss strategy.
View chart in interactive mode on ProRealTime.com.
Return to Top of Stock Market Chart Support
Return to Technical Analysis Charts