MACD
Trading Stocks Online
Trading Stocks Online: Moving Average Convergence Divergence (MACD) measures the strength and direction of a trend so you could say it is a combination of a trend and momentum indicator.
The MACD line is the difference between a fast moving Exponential Moving Average (EMA) and a slow moving EMA, usually the 12 day and 26 day EMA’s. So although the MACD line is only one line, this line is actually the result of a calculation using two lines or two moving averages.
The MACD can be interpreted in different ways depending on the trader’s strategy. Three of the most common interpretations are outlined on this page.
1. Negative or Positive MACD:
A bullish signal occurs when the MACD crosses above the zero line. A bearish signal occurs when the MACD crosses below the zero line.
The MACD crosses over the zero line into positive territory when the slower moving average (12 Day EMA) slower moving average crosses the faster moving average (26 DAY EMA). Many interpret this as a bullish signal. The MACD will stay positive as long as the upward trend is sustained.
The MACD crosses over the zero line into negative territory when the slower moving average crosses below the faster moving average – a bearish signal. The MACD will stay negative as long as the downward trend is sustained.
This indicator is demonstrated in the daily candlestick chart below of General electric. The blue line in the lower part of this chart is the MACD line. Note that if you select to display the MACD indicator on a chart the 12 and 26 day EMA’s do not normally display. They are on this chart to demonstrate the point.
Furthermore, when the 12 Day EMA is above the 26 Day EMA and the divergence between them is growing (i.e. getting wider) this can be interpreted as increasing momentum to the upside.
Similarly, when the 12 Day EMA is below the 26 Day EMA and the divergence between them is growing, this can be interpreted as increasing momentum to the downside.
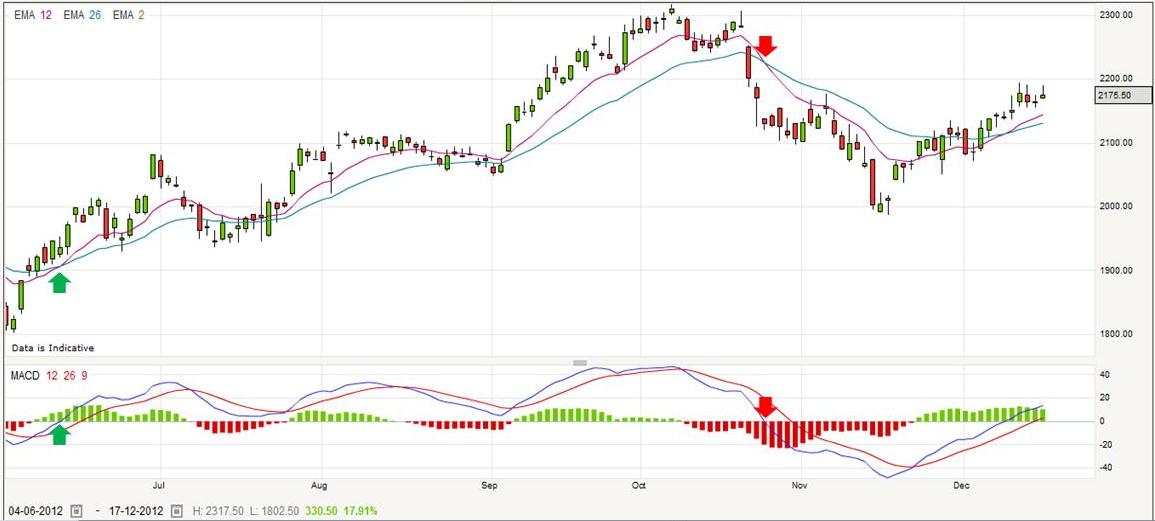
Trading Stocks Online: MACD. View charts in interactive mode at ProRealTime.com.
2. Signal Crossover:
The signal crossover makes use of a signal line. The signal line is a 9 Day EMA of the MACD itself and is shown on the lower part of the chart of General Electric below.
It is a bullish signal when the MACD crosses above the signal line. It is a bearish signal when the MACD crosses below the Signal line. Observe the places where the blue MACD line intersects with the red Signal line and see how the price action of the stock corresponds.
Prices tend to rise when the MACD crosses above the Signal line and fall when it crosses below the Signal line.
The MACD Histogram represents the difference between MACD and its 9-day EMA, the Signal line. The histogram is positive (green) when the MACD Line goes above its Signal line and negative (red) when the MACD Line crosses below its Signal line.
Acting on this indicator should be done with caution and traders may often use it in combination with other chart analysis. For example, a volatile market can produce a lot of crossovers.
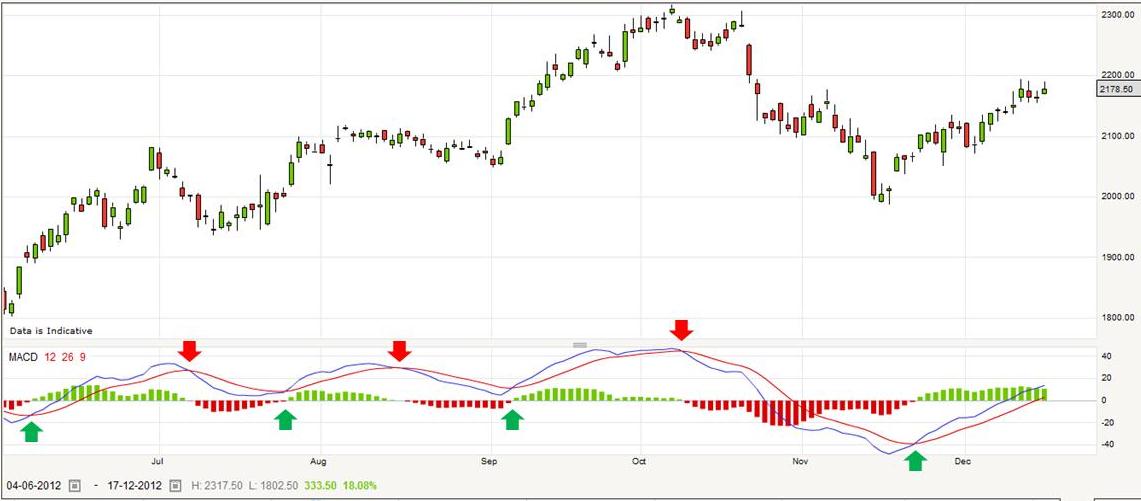
Trading Stocks Online: MACD. View chart in interactive mode at ProRealTime.com.
3. Bullish and Bearish Divergences:
When the MACD diverges from the price action of the underlying market it is frequently used as a signal to buy or sell.
Bullish Divergence occurs when the market makes new lower prices but the MACD does not and actually forms a higher bottom. This means that although prices have declined to new lows, momentum is actually running out of steam because the MACD does not decline to new lows. This can be interpreted as a buy signal.
Observe the chart below of Google. Google declines sharply (1) and the MACD corresponds by dropping lower (1). However, Google makes a further plunge lower (2) but the MACD diverges. Although the MACD moves slightly lower it does not break below the previous low (2). This can reveal a market running out of downward momentum despite lower prices.
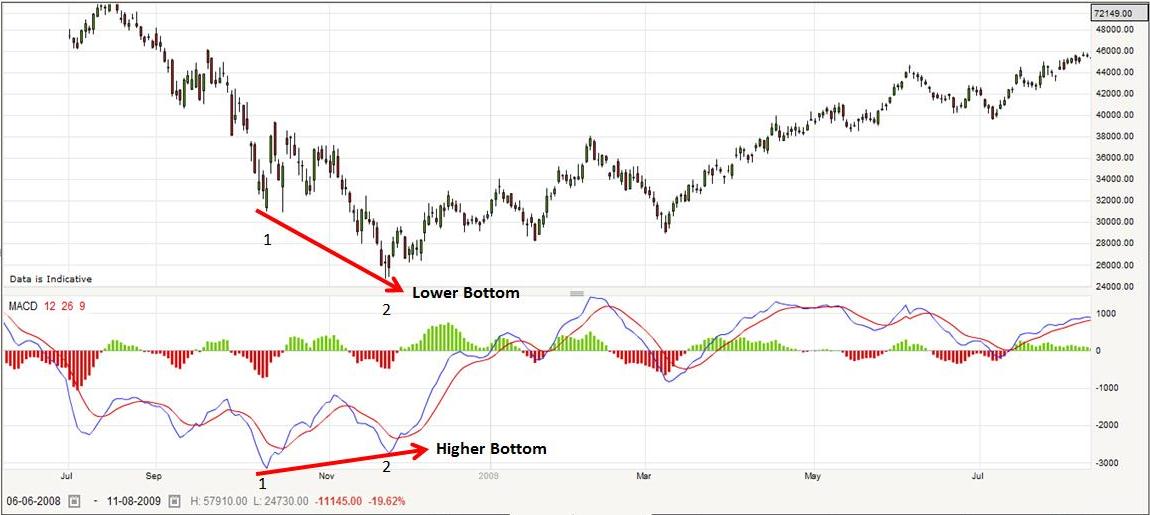
Trading Stocks Online: MACD. View chart in interactive mode at ProRealTime.com.
Bearish Divergence occurs when the market makes new higher prices but the MACD does not and actually forms a lower top. This means that although prices have advanced to new highs, upward momentum is actually decreasing because the MACD does not match the advance to make a new high. This can be interpreted as a sell signal.
Observe the chart of Google below. The market makes a high in early November (1) and so does the MACD. However, Google breaks to new higher prices in January (2) but the MACD cannot match its advance and makes a lower top. This is a warning that a decline may be forthcoming because of the decline in momentum.
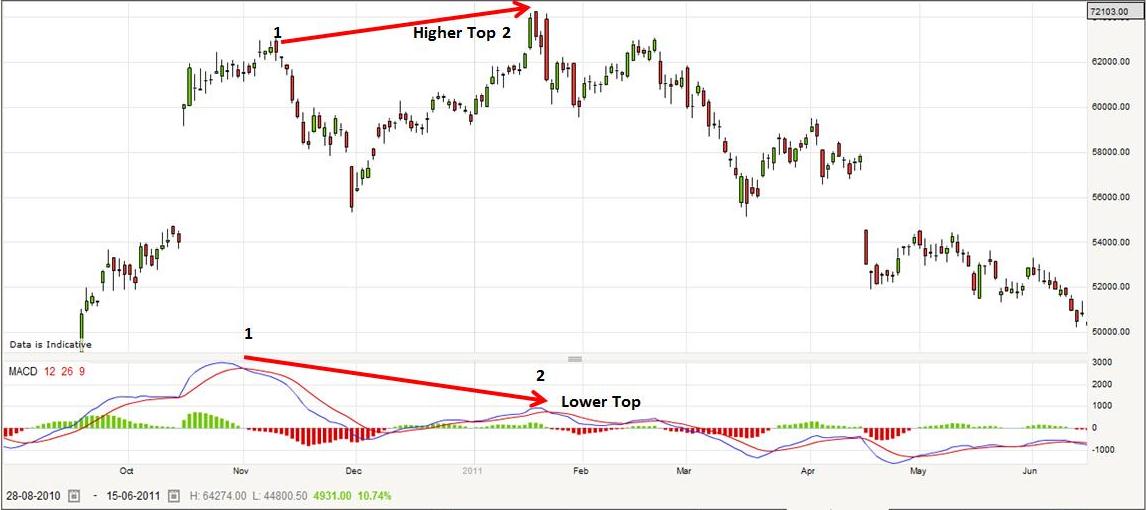
Trading Stocks Online: MACD. View chart in interactive mode at ProRealTime.com.
Both the Bullish and Bearish Divergences should be used in conjunction with other analysis. The market can signal a bullish divergence yet continue higher because momentum may be decreasing but not enough to turn the market lower just yet. Similarly the market may exhibit bearish divergence and continue lower. However, divergences can be used as a confirming indicator.
MACD can be used in trading Stocks, Exchange Traded Funds, Forex, Commodities, Bonds, Futures, etc. Traders should always implement appropriate risk management and stop loss strategies.
Return to Top of Trading Stocks Online: MACD