Stock Market Technical Analysis
Coppock Curve
Stock Market Technical Analysis: The Coppock Indicator or Coppock Curve was developed by Edwin S. Coppock who was an economist. His inspiration for the indicator was unusual because he proposed that stock market down turns were like a bereavement that required a period of mourning. According to bishops of the Episcopal Church to whom he was giving investment advice, the average period of mourning following a bereavement was 11 to 14 months. Coppock reckoned that this time period would be of importance in the length of downturns.
It is a long term momentum oscillator and is calculated by adding a 14-month rate of change in price (using the closing price), and 11 month rate of change, smoothed by a 10 month weighted moving average. Rate of change is a technical indicator that measures the percentage change between the most recent price and the price of a selected number of periods in the past. A weighted moving average allocates more importance to more recent prices.
Initially it was designed as a long term indicator for the U.S. stock market and helps to identify buying opportunities near the bottom of bear markets. Recognised by many investors as a very effective signal, it has worked 19 out of 22 times since 1920 on US stock market indices. As a long term indicator, then, it will not generate many buy or sell signals.
A move of the oscillator above the 0 line into positive territory is interpreted as a buy signal. A move below the 0 line into negative territory is interpreted as a sell signal. Some investors would go long when the line turns up from a trough below the 0 line rather than waiting for it to cross the 0 line. Furthermore, many investors would ignore the sell signal when it crosses below the 0 line. This is because Coppock designed it to identify those relatively seldom periods when it the optimum time to invest in stocks for the long term – that is after a crash or the end of a bear market. It is not a predictor of the market bottom but signals the relatively early stage of a subsequent rise in prices.
A more aggressive way to use the Coppock indicator is with bullish and bearish divergences but a trend reversal is not guaranteed. A bullish divergence is occurs when the market make a new higher top but the indicator makes a lower top. A bearish divergence occurs when prices decline to a form lower bottom but the indicator makes a higher bottom. It is a sign that momentum may be running out.
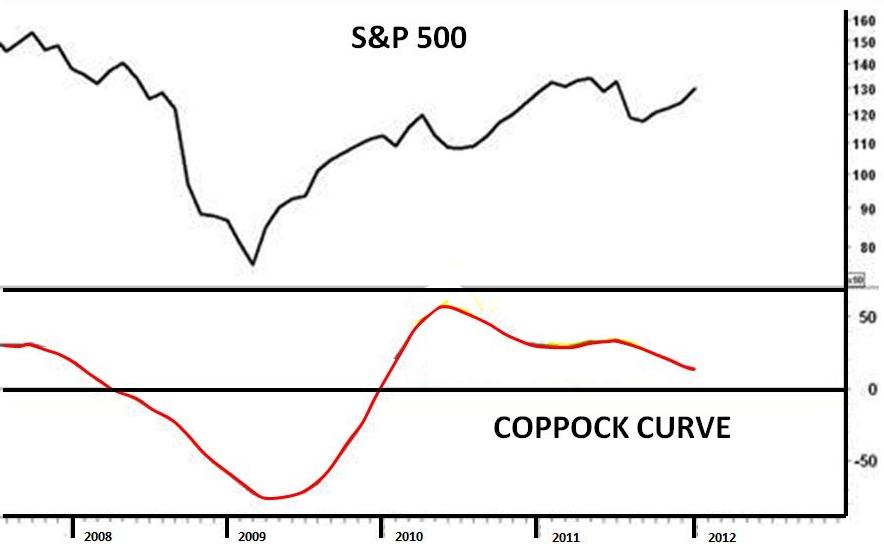
The accompanying chart shows the Coppock indicator for the S&P500 from mid-2007 to 2012. In this case it was very successful as it turned up after the major multi-annual low in March 2009 during the financial crisis. A long term investor who invested in stocks when the Coppock indicator reversed would be very happy as the market rallied for a number of years afterwards.
Stock Market Technical Analysis: Coppock Curve
Stock Market Technical Analysis: Coppock Curve
Return to Top of Stock Market Technical Analysis: Coppock Curve