Moving Averages
Futures Trading Strategy
Futures Trading Strategy - Moving Averages: Moving Averages are a powerful tool for analysing the trend in the market. They smooth out the noise in price variation and often provide support and resistance.
Traders often use them as a confirmation indicator in combination with other analysis in deciding which direction to trade. In addition, two moving averages are often used to generate buy and sell signals in the market. They are a very popular and often used in futures trading strategy. However, it is important to realise that because they are a lagging indicator, a significant move may have already occurred before a trading signal is generated.
The way a simple moving average is calculated is by using the average price of a financial security over a specific number of periods. Usually the closing price of the period is used so a 10 day moving average would use the daily closing price of the previous 10 days. For example:
Daily Closing Prices for 10 days: 20, 21, 22, 23, 24, 25, 26, 27, 28, 29
First day of 10-day MA: (20 + 21 + 22 + 23 + 24 + 25 + 26 + 27 + 28 + 29) / 10 = 24.5
Second day of 10-day MA: (21 + 22 + 23 + 24 + 25 + 26 + 27 + 28 + 29 + 30) / 10 = 25.5
Third day of 10-day SMA: (22 + 23 + 24 + 25 + 26 + 27 + 28 + 29 + 30+31) / 10 = 26.5
Each day, the most recent day's price is added to the sequence while the first day is dropped from the sequence. We can see that the average price is moving upwards tracking the upward trend of the market. These prices would be connected with a line on a chart.
The shorter the length of the moving average used, the more sensitive it is a securities price movement. In general the longer the time frame of the investor/trader, the longer the moving average utilized. A long term investor may use a 200 day moving average, a 50 day average for a medium term trader, while a shorter term trader might use the 10 day moving average. Observe the chart of the Dow Jones Daily Rolling Futures contract below which has a 25, 50 and 200 day moving average on it. As the market bottoms out and rallies in March 2009, the 25 day moving average turns upward first, then the 50 day and then the 200 day.
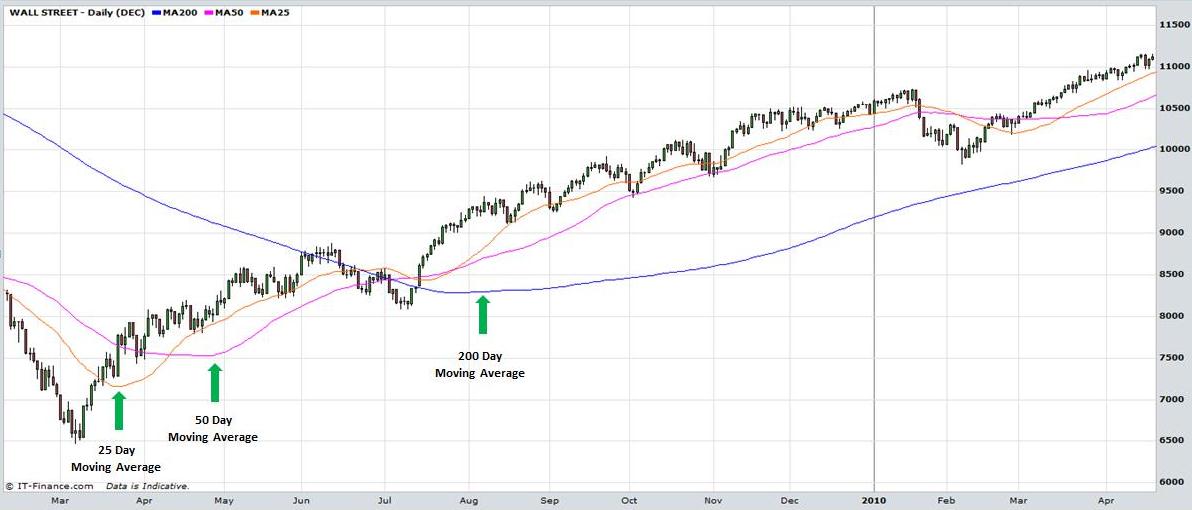
Futures Trading Strategy: Moving Averages. View chart in interactive mode at ProRealTime.com.
Below is a longer term chart of the Dow Jones Daily Rolling Futures contract from April 2007 to December 2012. The 50 day moving average turns down when prices decline in October 2007. Observe how the line cannot sustain a move upward during the decline from October 2008 to March 2009.
Note that because it’s a
lagging indicator, prices turn down before the line moves down. Again, when the
market rallies in March 2009, the line doesn’t turn upward until early April. Furthermore,
just because the market may rally above the moving average doesn’t mean the
long term trend has definitely changed. For
example, the line turned upward briefly in April 2008 before prices plunged
again. This is why the moving average is used as a confirmation indicator alongside
other indicators whether they are based on fundamental analysis
or technical analysis.
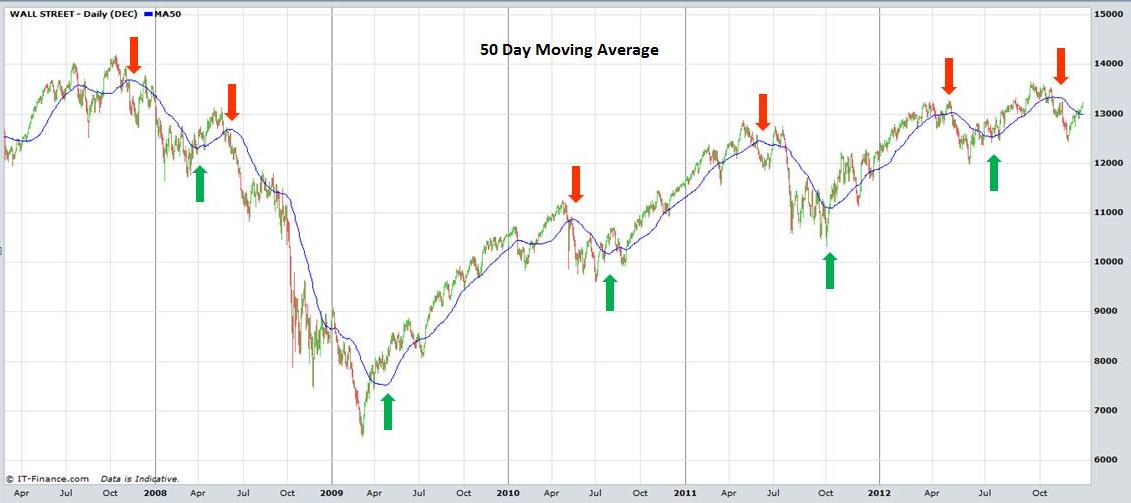
Futures Trading Strategy: Moving Averages. View charts in interactive mode at ProRealTime.com.
More frequently, two averages are used to generate trading signals, a longer term and shorter term average.
For example, a trader may combine a 50 and 200 day moving average. The shorter term average reacts quicker to the price action. When the shorter term average crosses below the longer term average it can be interpreted as a sell signal (a death cross). If the shorter term average crosses above the longer term average it can be interpreted as a buy signal (a golden cross). The longer the moving averages used, the more significant the crossover. For example, a 10 day moving average moving under a 25 day moving average may not be of huge importance to a longer term investor. However, if the 50 month indicator was to move below the 200 month indicator, this could signal a long term bear market.
Observe the same chart of the
Dow Jones Rolling Futures Contract below but the 200 day moving average (in
pink) is also used. The 50 day moving average crossed below the 200 day moving
average in early January 2008 and the market declined dramatically for 15
months until March 2009. It wasn’t until July 2009 that the 50 day moving
average managed to climb above the 200 day moving average. Many traders would
interpret this as a signal to go long and indeed the market did continue its uptrend
for ten months after this buy signal.
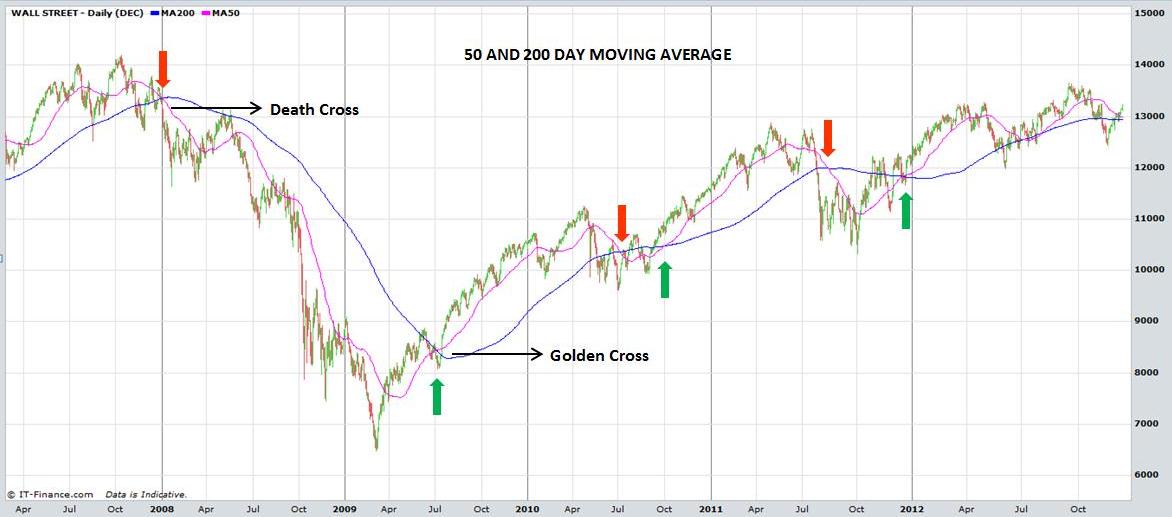
Futures Trading Strategy: Moving Averages
As with all indicators, however, there is no such thing as a guarantee and trades need to be managed with stop losses. Look how the 50 day crossed below the 200 day in July 2010 and August 2011 before recovering. Some traders wait for the 50 day to cross the 200 day by a certain percentage to provide even further confirmation before deciding on their position.
The moving averages discussed so far are known as Simple Moving Averages. Another one utilized in technical analysis is the Exponential Moving Average. Essentially this moving average allocates more importance to more recent prices. For example, with a 10 day moving average, Day 10 (the last day in the sequence) will have a stronger weighting in calculating the moving average rather than Day 1 (the first day in the sequence). It is interpreted in the same way as the simple moving average but is slightly more responsive because it reacts to new prices quicker.
Observe the chart below of the Dow Jones Rolling Futures contract from March 2009. It shows a 10 day simple and exponential moving average. Most of the time they move pretty closely together but at more significant turning points the exponential is more responsive and reacts first. Traders often favour the Exponential Moving Average because of this quicker response.
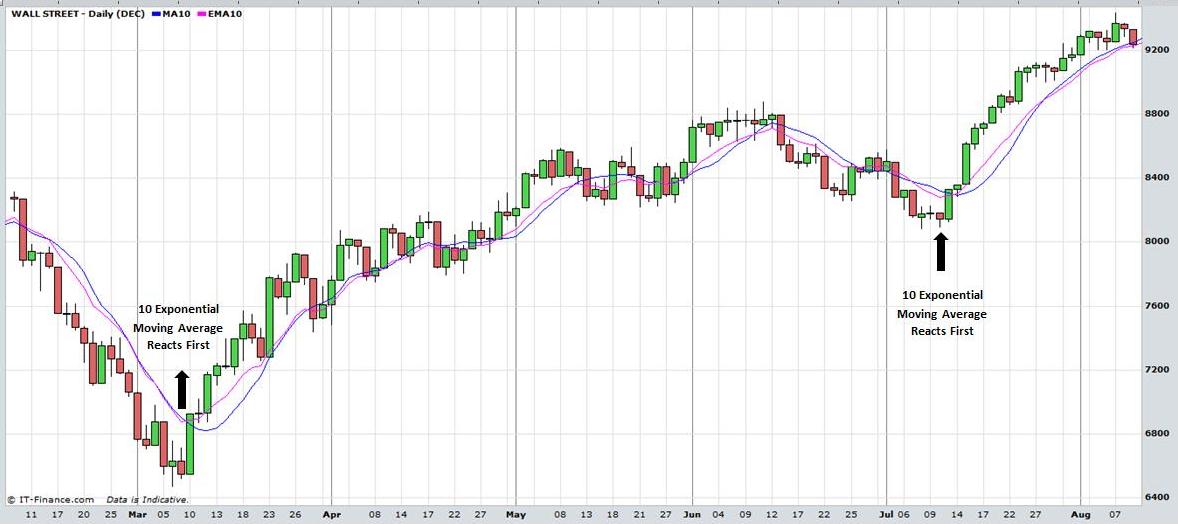
Futures Trading Strategy: Moving Averages.
Finally, it was mentioned earlier how moving averages can provide support or resistance. Look at the chart below of the 10 day moving average in the Dow Jones Daily Rolling Futures contract from February to June 2011. When prices broke above the 10 day on 16th February the market received support on the 10 day line all the way up until the end of April. As prices capitulated it also acted as resistance. The market broke down through the line in early May and the market rallied back to the 10 day moving average line on the 12th, 18th and 28th May before it was able to break upwards. Do not expect the market to react exactly on the moving average line. Due to market volatility prices can break through briefly before returning to the previous trend.
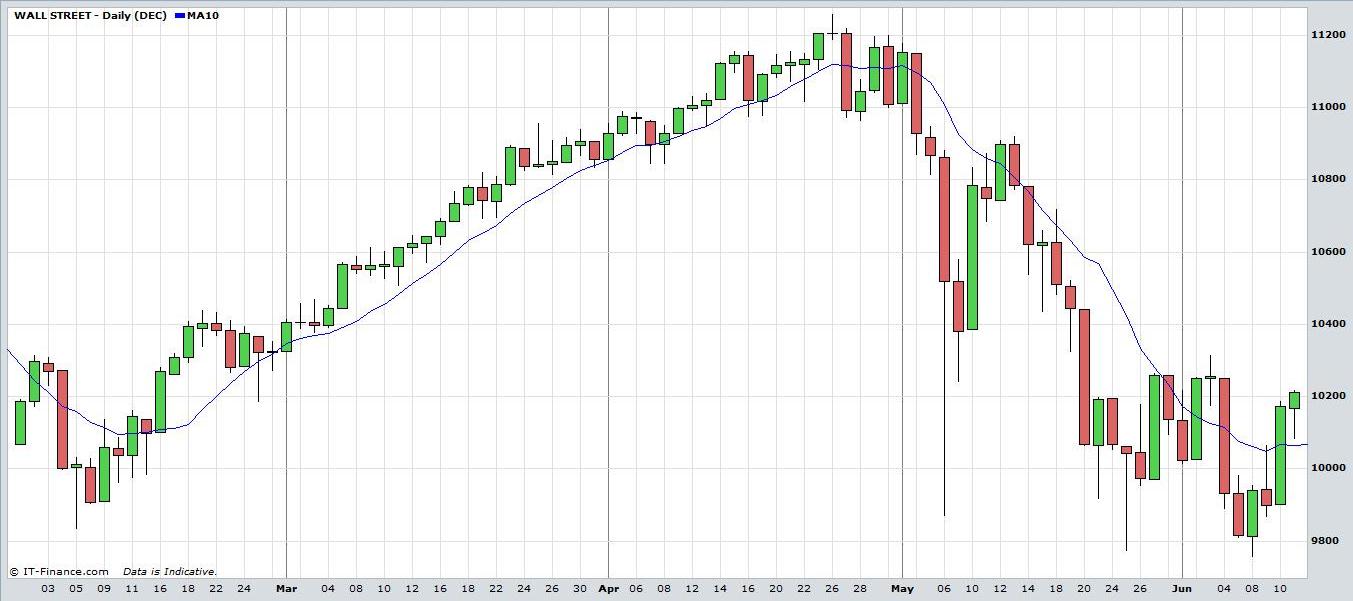
Futures Trading Strategy: Moving Averages.
Moving Averages can be used in trading Stocks, Exchange Traded Funds, Forex, Commodities, Bonds, Futures, etc. Traders should always implement appropriate risk management and stop loss strategies.
Return to Top of Futures Trading Strategy: Moving Averages