Free Forex Trading System
Candlestick Charts Part 1
Free Forex Trading System – Candlesticks: This form of charting was first used in Japan on the Rice Exchange in the late 1600’s. Munehisa Homma, a legendary Japanese rice trader during the 1700’s is recognized as the father of candlestick charts probably because he gained a huge fortune using candlestick analysis. It wasn’t until the 1990’s that they were popularized in the Western world by Steve Nison in his book Japanese Candlestick Charting Techniques. Today they are widely used in technical analysis and charting software around the world.
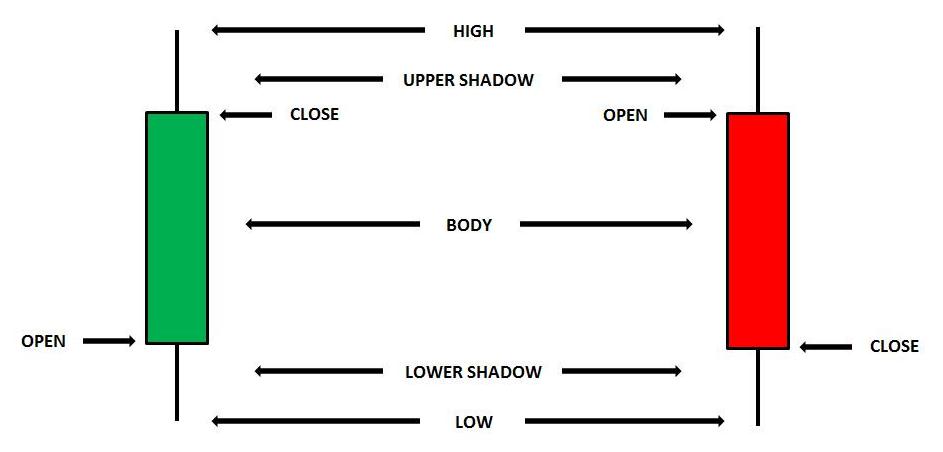
Candlestick charts in fact
only differ from bar charts in that the area between the open and close is
shaded. This section of the bar is known as the body of the candle. The default
option on most charting packages is that the body is shaded red when the close
is lower than the open. It is shaded green when the close is higher than the
open. The high of the shadow is the highest price at which the financial security
trades at during the trading period and it’s the same for the low. For traders
that use candlestick patterns they are much clearer and easier to spot when
they are shaded than on a normal bar chart. Some charts use a white body when the close is higher and a black body when the close is lower.
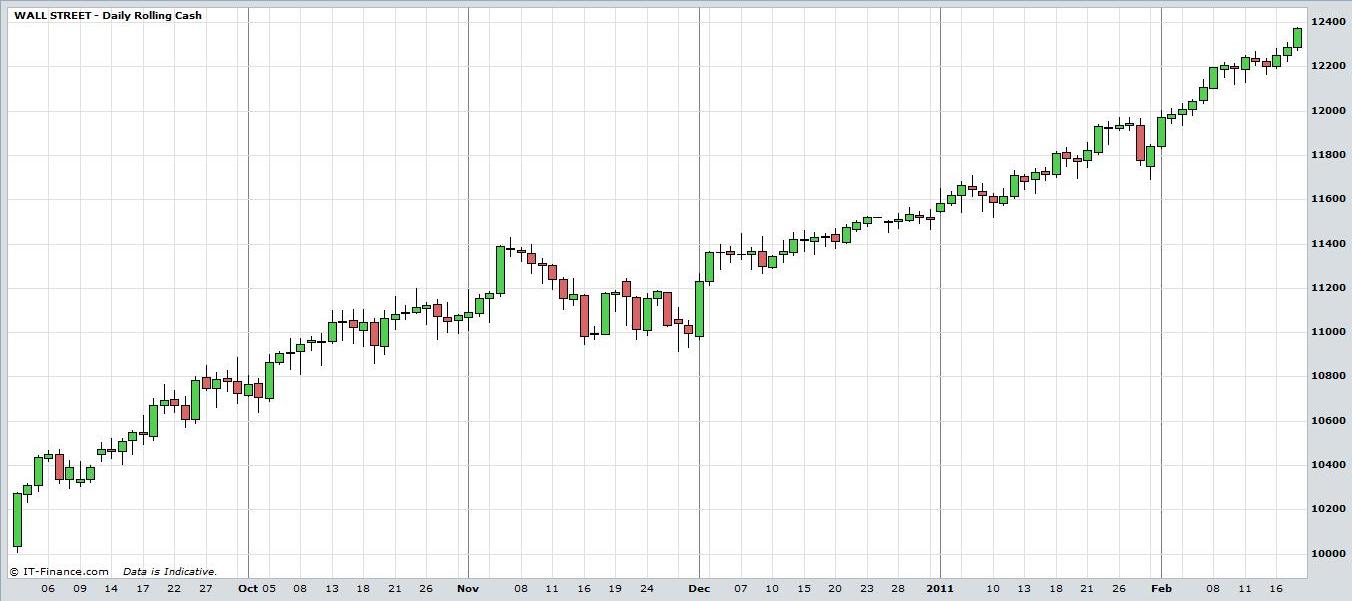
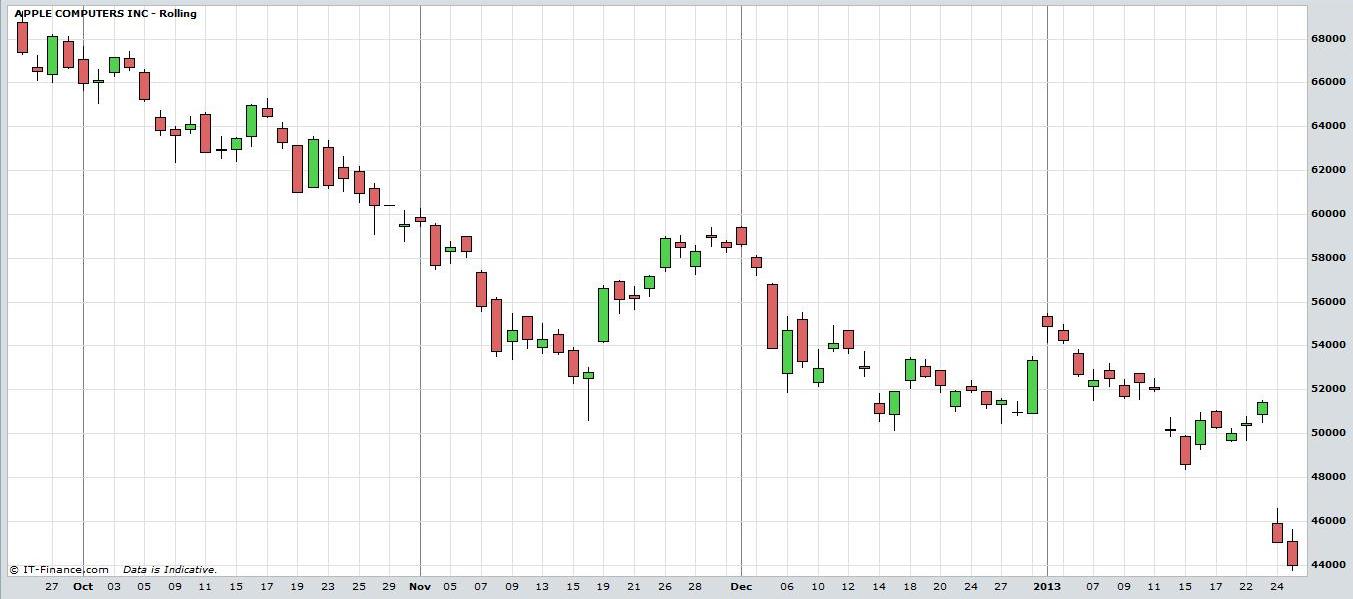
Candlesticks can be used in any time frame be it an intra-day period, daily, weekly, monthly or annual chart. They can also be used on any financial security including Stocks, Exchange Traded Funds, Currency Futures / Forex, Commodities, Bonds, etc. Below is an example of a daily candlestick chart of the Dow Jones Index. It was trending very strongly upwards from September 2010 to February 2011. Note how most of the candlesticks are green because obviously the market has to close higher than the open to form an uptrend. Similarly most of the candles are red in the downtrend of Apple from September 2012 to February 2013.
Free Forex Trading System: Candlestick Patterns
Candlestick formations are used to interpret market action and have been given many different names over the years. Although these formations may be interpreted as bullish or bearish, there is of course no guarantee that the market will conform to this interpretation. In horse racing parlance, they assist traders in “reading the form” of the market.
Return to Top ofFree Forex Trading System: Candlestick Charts Part 1