Stock Market Charti ng
Resistance
Stock marketchartingresistance is useful in identifying times to sell when a companies share price reaches a certain level. The concept of resistance is an important one in trading financial markets and technical analysis. Technical analysts will use charts to identify resistance levels in Stocks, Exchange Traded Funds, Forex, Commodities, Bonds, Futures, etc. Resistance refers to a price level at which a financial security regularly finds sellers and fails to move higher. Traders may sell or go short at a recognised resistance level in anticipation that the market will fall in price simply because it has already proven that sellers have sold there before. Resistance levels can be identified in any time frame whether that be on an intra-day, daily, weekly or monthly chart. The market may not turn on the exact price that it has done so previously. Markets can become quite volatile at resistance so traders need to allow for price fluctuations as it approaches a previous level of resistance.
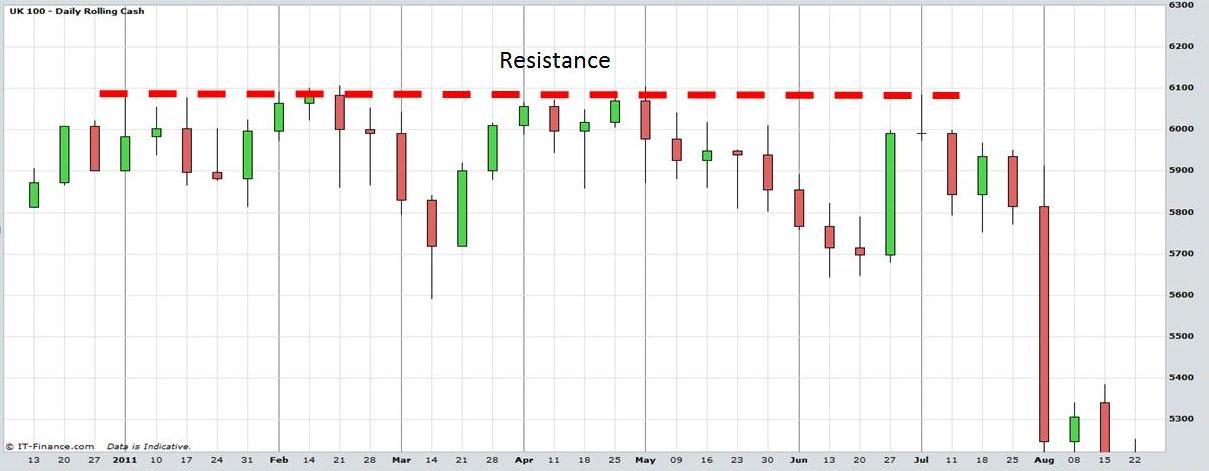
The accompanying chart is a weekly candlestick chart of the FTSE100 stock market from mid-December 2010 to mid August 2011. The chart shows how the FTSE made several tops at the 6100 level and could not break through this price level. Despite making four attempts ( the first half of January 2011, the first half of February, all of April and one final attempt in early July) the stock market just could not break through this level. Finally it broke down after the final attempt with a strong rapid decline in August 2012.
By February traders would have observed how the FTSE was having difficulty at the 6100 level. Each time the market approaches this price then traders are looking to sell. Those who sold in July had the opportunity to make alot of money by mid-August as a result of this analysis. So we can see the advantage of using this basic concept of technical analysis to profit from financial markets. Furthermore, it demonstrates that making money from trading is not necessarily a complicated process.
The concept of resistance worked very well in this example. However, be aware that if a market breaks through an important resistance level it can lead to rapidly higher prices. As always, a trader should be prepared for a possible breakout in price and implement appropriate risk management and stop loss strategies.
Stock Market Charting Resistance
Stock Market Charting Resistance. View charts in interactive mode at ProRealTime.com.
Return to Top of Stock Market Charting Resistance Page
Return to Technical Analysis Charts