Currency
System Forex Trading
Commodity Channel Index
Currency System Forex Trading: The Commodity Channel Index (CCI) was developed by Donald Lambert to identify cyclical turns in commodities but can be applied to all financial markets including Stocks, Exchange Traded Funds, Forex, Bonds, etc.
It is an oscillator that measures how far a securities price has deviated from its average. The CCI is higher when prices are above their average and lower when prices are below their average. A move above or below the 100 line levels means the market has moved away from its typical price.
The calculation of the Commodity Channel Index is quite complicated but uses a moving average of the set time frame, mean deviation and a constant of 0.015. For Lambert, a move above 100 meant the commodity was in a strong uptrend. A move below minus 100 meant the commodity was in a strong downtrend. Since then, however, traders have developed other ways of using the indicator. Like all oscillators it can identify overbought/oversold levels and price/oscillator divergences. Traders, therefore, would usually use other analysis to back up their trading strategy.
Look at the daily candlestick chart of USD/CHF
currency pair below. Observe how the market often makes a top after prices
exceed the plus 100 line and make a low after prices go below the + 100 line. The price moves above and below these levels
are a possible indication of overbought and oversold levels. No indicator works
100 per cent of the time of course. See how the indicator breaks above the 100
line in May and continues a strong upward trend.
This an example of why traders use a number of indicators perhaps in combination with a chart pattern before entering a trade. In an uptrend, for example,
traders may wait for a pullback in prices, finding support at a moving average and an oversold
indication on the CCI to enter a long
position. A range trader on the other hand might use the CCI as
a confirming indicator to buy or sell at the top or bottom of the range and implement an appropriate stop loss strategy.

Currency System Forex Trading: Commodity Channel Index. View chart in interactive mode at ProRealTime.com.
Another way to interpret the CCI is through bullish and bearish divergence. Bullish divergence occurs when markets fall to new lows but the CCI does not. Bearish divergence occurs when prices make new highs but the CCI cannot move to new highs.
Observe bullish divergence in the next chart of the EUR/USD. Prices decline to form a bottom at the 1.2950 level in mid-December and the CCI also makes a bottom. However, prices decline to form a lower bottom in January near 1.260 but the CCI makes a higher bottom. This often indicates that the market is oversold because although prices have declined further the CCI shows that momentum to the downside is not matching the price action.
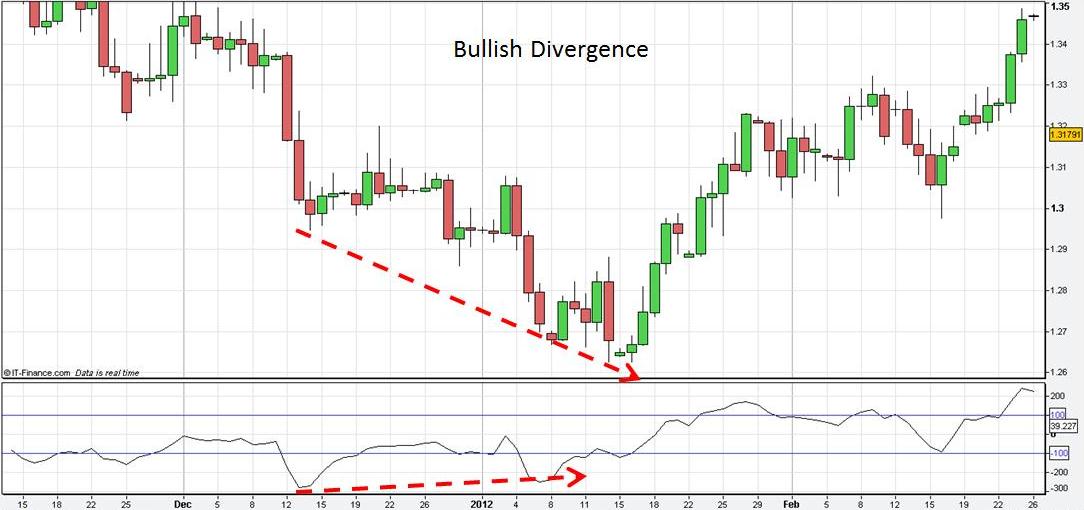
Currency System Forex Trading: Commodity Channel Index.
The accompanying chart of NZD/USD is an example of bearish divergence. The market makes a new high in late May and this is accompanied by a new high in the CCI. By the end of July prices have risen sharply but the CCI makes a lower top. Once again this is an indication of a move running out of momentum and indeed the market declines from this high.
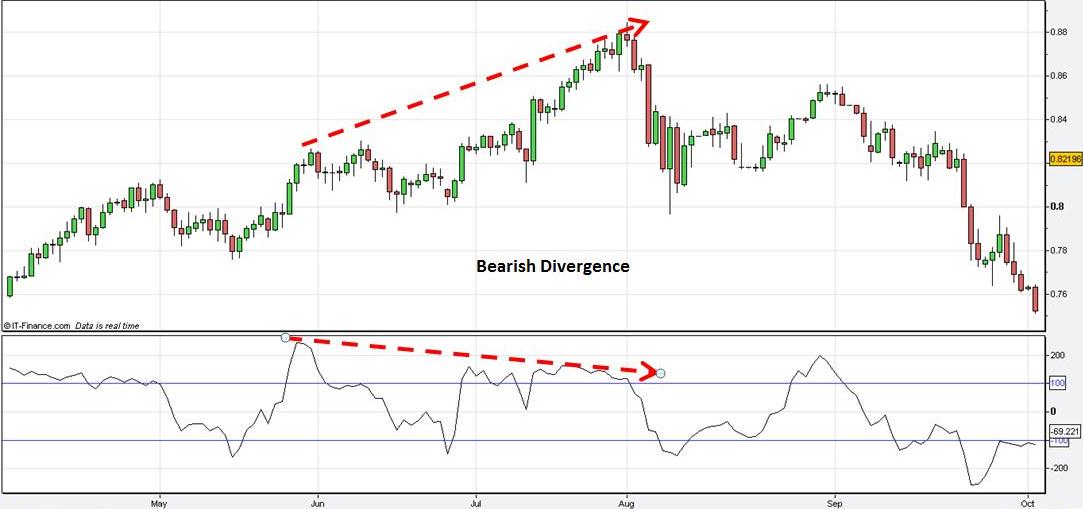
Currency System Forex Trading: Commodity Channel Index.
Return to Top of Currency System Forex Trading: Commodity Channel Index.