Point and Figure Charting
Point and Figure Charting has been used for over 100 years. In the days before computers stock traders often kept a record of stock prices using this method.
The benefits of using a
Point & Figure Charts are that they:
- Eliminate small price movements
- Highlight price movements that may be of significance
- Eliminate the element of time
- Allow easy identification of support, resistance and trendlines.
A point and figure chart is unusual in that it ignores time. The chart only moves when there is a significant move in price. This unit of price movement is determined by the person who constructs the chart. The advantage for the trader is that it eliminates insignificant price reversals that are below a minimum value. The choice of the price movement then is critical.
An X is used when the market moves up the minimum price increment. An O is used when the market moves down the minimum price movement. A new column, therefore, does not start every day. It only begins when the market reverses that minimum price unit.
An example is shown below. The chart is in a grid like format and X’s and O’s are placed in the boxes as prices advance and decline. X columns represent an advancing market and O columns represent falling prices.
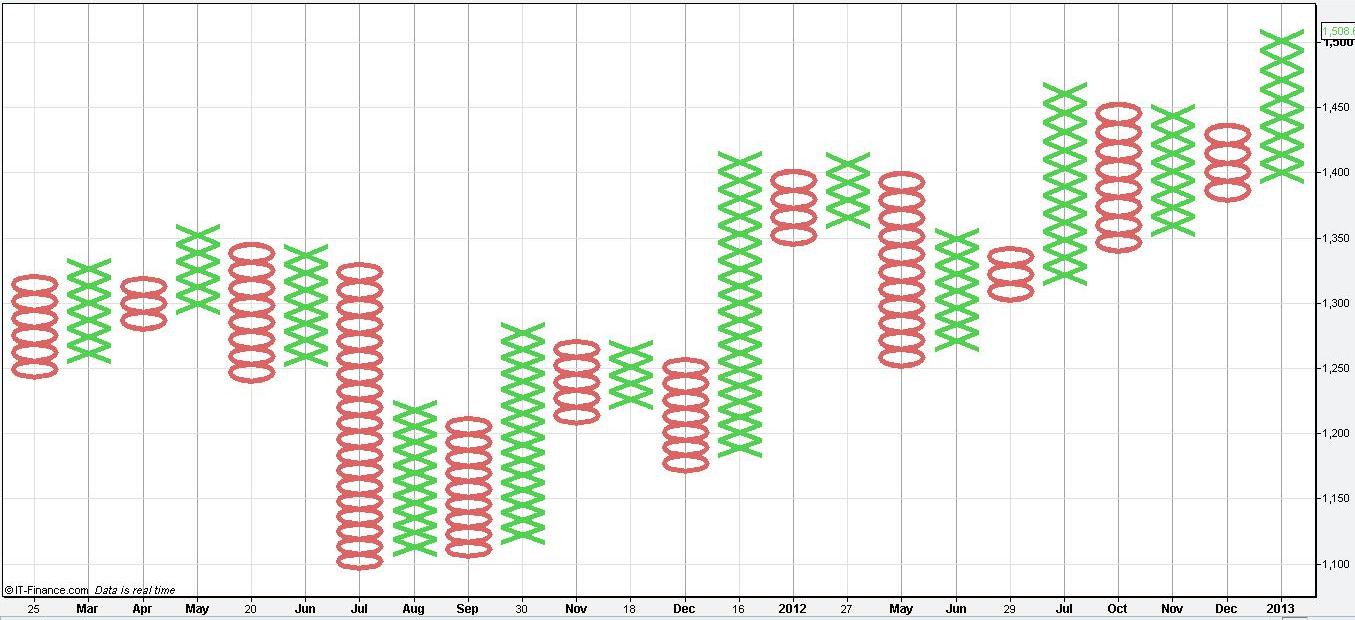
Let's take a basic example. A trader/investor decides on a $1 move as the minimum price increment. Each box size, therefore, represents a $1 price movement. A price reversal of $1 upwards will result in an X in a new column. The X is placed one box higher. A price reversal of $1 downwards will result in an O in a new column. The O is placed one box lower. This means that price movements less than $1 are not recorded and eliminates “minor” fluctuations.
Fluctuations can be smoothed even further by only recording price movements of a minimum number of boxes. This number of boxes is called the reversal amount. A new column is only started when price has moved by that amount. For example, a trader may decide that the market must move $3 before moving to a new column. This reduces the price sensitivity of the chart even further.
The minimum price increment will depend on the value of the stock. A $1 price increment on a $10 dollar stock is too large because it requires a 10% move before beginning a new column. This would be too much for most traders. Conversely, a $1 increment on a $600 stock may be too small because this only requires a 0.16% move of the stock before beginning a new column. This would result in too many columns because of the price sensitivity. Alternatively, a set percentage price movement can be selected for each box instead of a price increment. For example, a box value of 1% would require a stock to move 1% before entering an X or O.
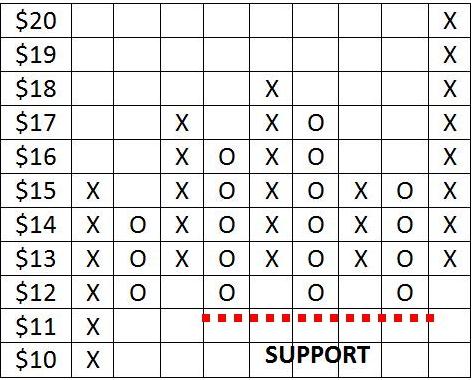
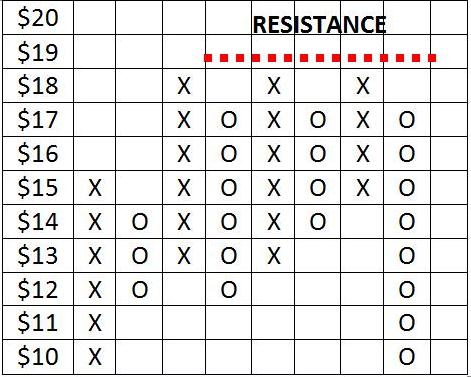
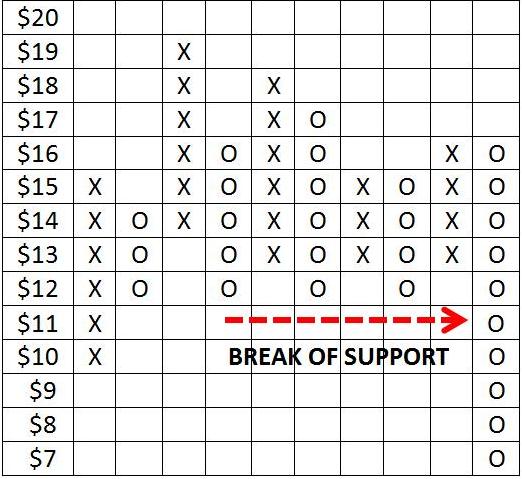
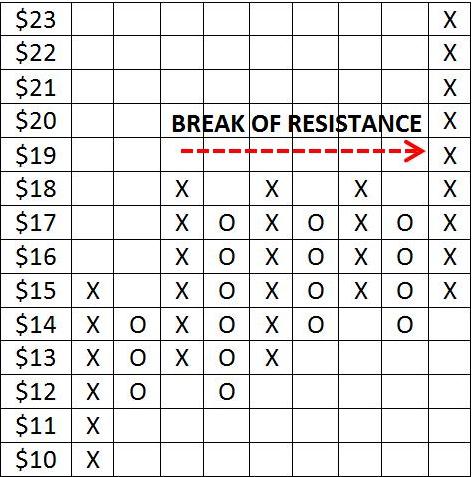
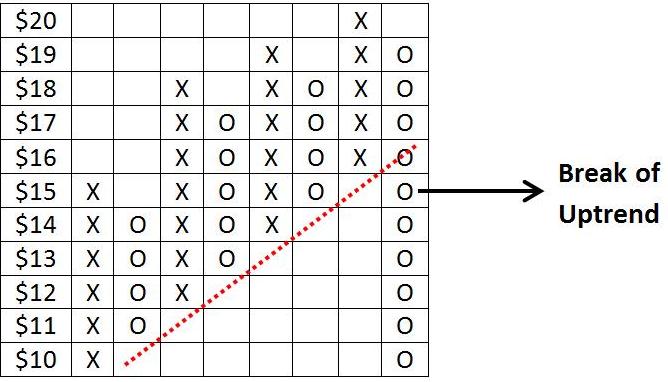
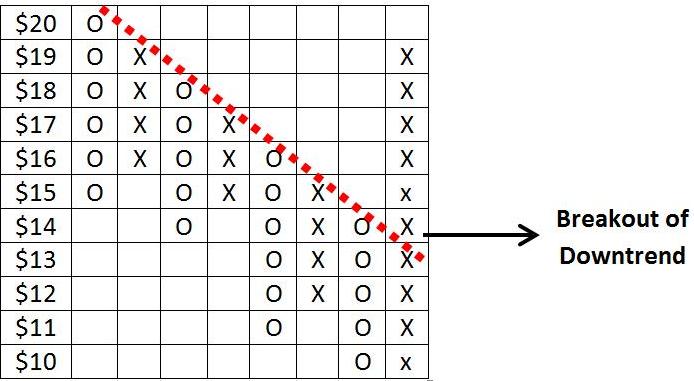
Chart patterns can also apply to point and figure charts. Below are examples of support and resistance, breaks of these levels and breaks of an uptrend and downtrend.
For further study on Point
and Figure Charting read “The Definitive Guide to Point and Figure” by Jeremy
du Plessis.Traders should always implement appropriate risk management and stop loss strategies.
Return to Top of Point and Figure Charting