Double Tops & Bottoms
Stock Chart
Stock chart analysis is necessary to find good trading opportunities. Some of the best trading strategies involve identifying and trading double bottoms, double tops, triples tops and bottoms. These patterns can form in all markets including Stocks, Exchange Traded Funds, Forex, Commodities, Bonds, Futures, etc.
- The first bottom on a double bottom pattern forms at the end of a downtrend.
- The bottom forms and there is a rally in the market. The extent of the rally will vary. There is no set percentage required but experience in looking at charts will help in identifying what a double bottom should look like.
- The second bottom is when the market retests the support met at the first bottom.
- The market does not need to turn at the exact price at which the first bottom was made. Often traders allow a 3% band around the price of the first bottom to match the criteria of a double bottom.
- Traders looking for a double bottom like to see a rally on increased volume to demonstrate that buyers are coming back into the market.
- The market needs to break the neckline (the last highest price on the stock chart) to be considered a double bottom. If the market meets resistance at the neckline and fails to break through to new levels then it may be entering into a period of congestion.
- If the market does break the neckline then the neckline itself may become a new level of support.
- Traders typically look for the market to reach a target price that is double the range of the double bottom to the neckline. In other words they take the rally from the bottom to the neckline and add it on to the neckline to estimate a price the market could reach. However, be aware that the market may not make it all the way before declining again. Appropriate risk management and stop loss strategies should be in place. Nevertheless a double bottom is an excellent opportunity to make a profit.
In the weekly candlestick chart of oil below, following a sustained decline the market made its first bottom in August 2011 at the $75.62 level. It then rallied to $90.50 in September. A decline then began to make a second bottom at $75 in early October. The market rallied from the second bottom and eventually reached a price of $110 by February 2012.
Lets call the price movement from the neckline to either bottom as $15. Adding $15 to the neckline at $90.50 gives a price target of $105.50 which the market reached and surpassed in February 2012.
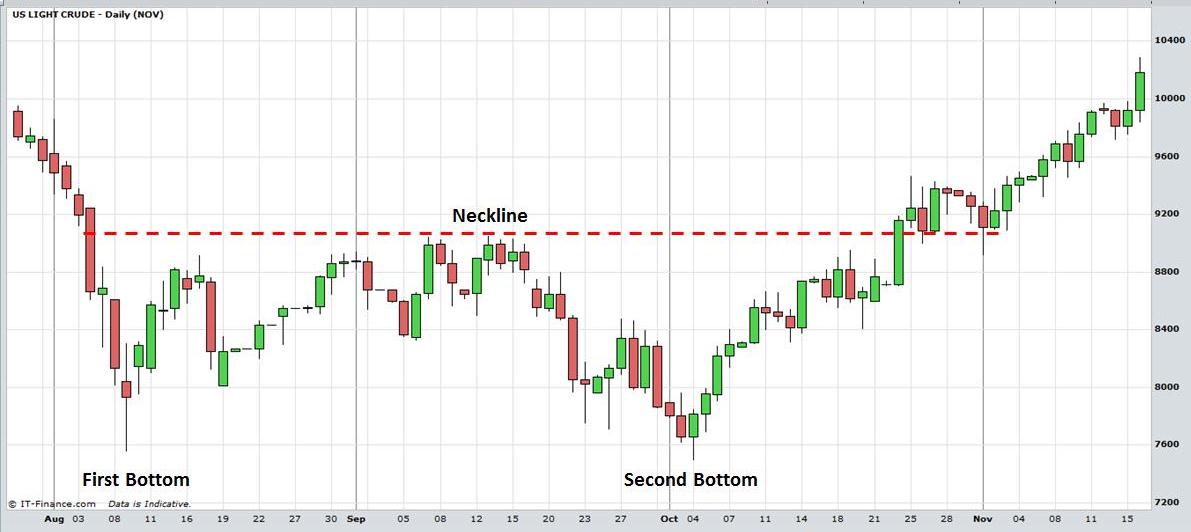
Stock Chart: Double Bottom. View charts in interactive mode at ProRealTime.com.
A double top works the same way as a double bottom except in reverse. The market rallies to the first top, declines and then rallies again to re-test the previous resistance level (the first top). If the market fails to break new highs then traders may look for a double top and take a short position.
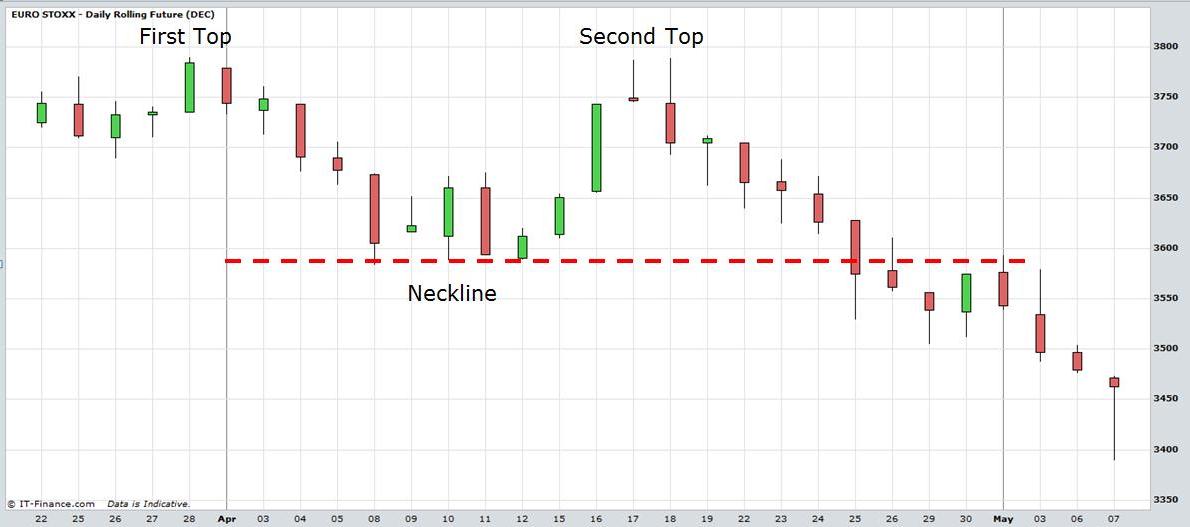
In the daily candlestick chart of Euro Stoxx below the market made double tops at
the 3790 level on 28th March and 18th April. The decline to the neckline was 205
points to 3585 on 8th April. To estimate a target for an exit from a short
trade, a trader might subtract that range 205 points from 3585 to give 3380.
The market reached 3390 on 7th May but in fact went to 3380 and lower in June.
Return to Top of Stock Chart: Double Tops and Bottoms
Return to Technical Analysis Charts