Day Trading Stock Online
Volume
Day Trading Stock Online: Volume is the number of shares or contracts traded in a financial security. It is a simple but useful indicator that can be employed in trading any time frame or financial security. Typically volume is used to confirm the strength of a price movement. If the market closes strong on high volume it indicates strong buying pressure. A weak close on high volume indicates strong selling pressure.
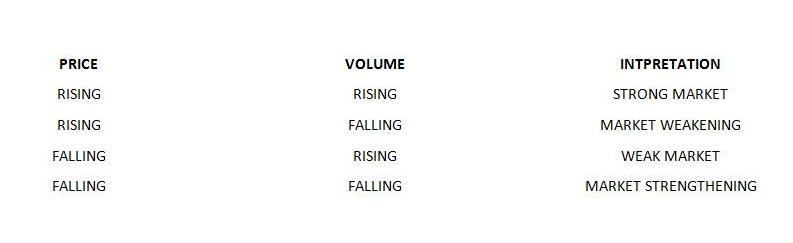
Volume can be an important indicator at major turning points in the market. The start of a new trend can be accompanied by a large increase in volume as traders and investors initiate new positions.. A decrease in volume can signify the end of a trend as the market loses momentum and traders lose interest or certainty. Lack of volume, therefore, may warn of a reversal. A basic way of interpreting volume is outlined in the table below.
Volume is not a stand-alone indicator but is very useful in providing confirmation in combination with other technical analysis indicators. The following charts demonstrate practical ways of interpreting volume.
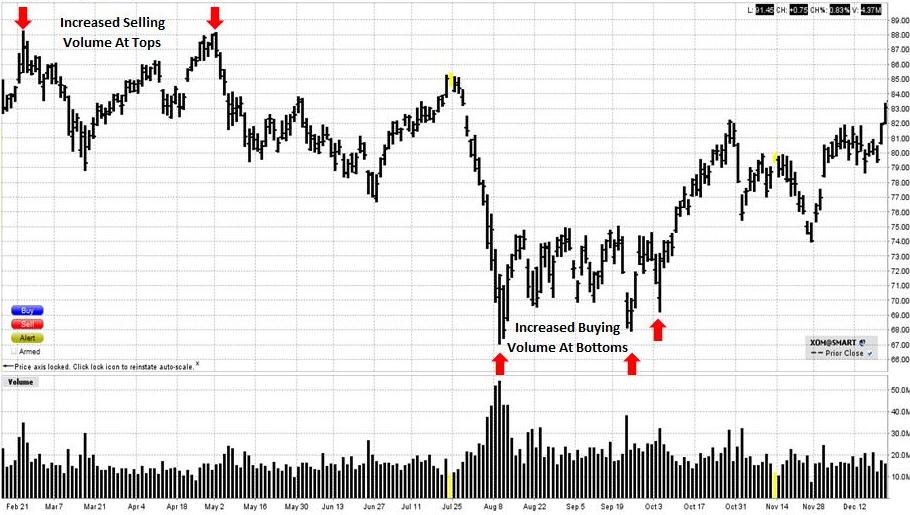
Observe, on the daily bar chart of Exxon Mobil how the volume increases when the market tops out in February and May 2011. The subsequent declines from these levels indicate that the sellers are exerting more pressure. Similarly, volume increases dramatically at the bottom in August indicating that the buyers are regaining control. The market begins to rally again.
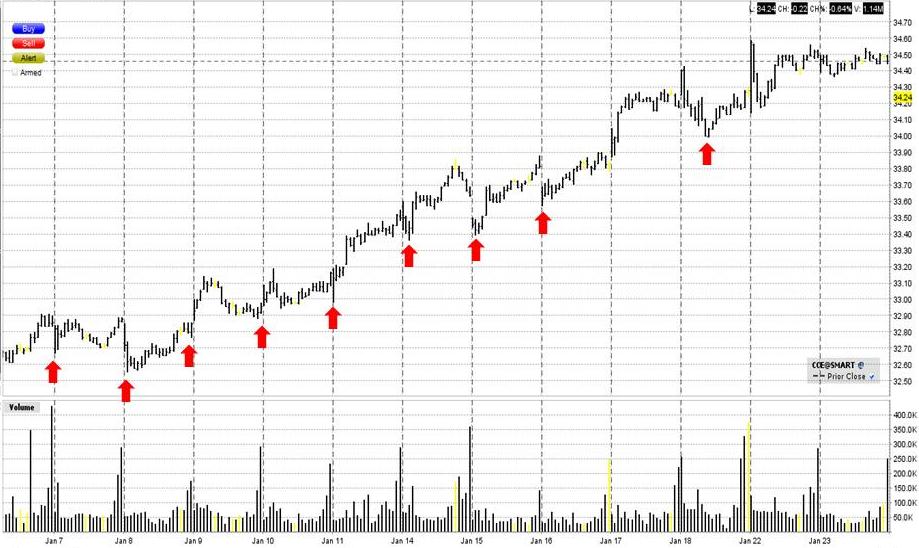
The 20 minute bar chart of Coca-Cola below demonstrates how volume behaves during a strong uptrend. Volume tends to increase on the dips. Traders trading with the trend are on the lookout for this. The market may decline abruptly scaring some traders, who don’t wish to lose profits, out of their long positions. As the “storm” subsides and volume decreases, buyers may come back in to go long the stock at these lower prices. Volume may be strong out of the dip as well as buyers may rush back in quickly reversing market direction.
Another way of interpreting volume is when volume begins to decline even though prices continue to advance during an uptrend or decline during a downtrend. This indicates that the trend may be running out of momentum and about to turn. However, be aware that a market can continue its trend for an extended period of time despite declining volume.
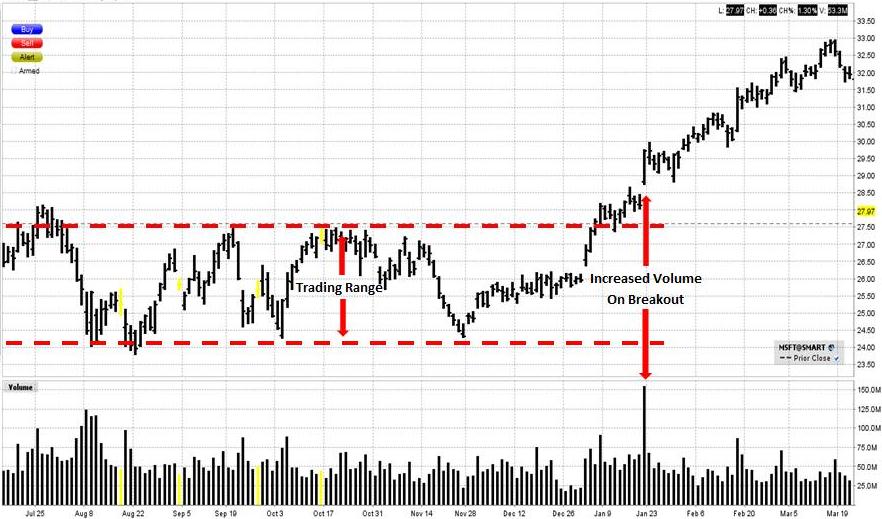
The next chart of Microsoft demonstrates how volume can be used to confirm a breakout from a trading range. See how Microsoft was trading between $24 and $27.50 for 6 months between August and January. Sometimes a market can break out of a trading range and then reverse direction shortly after, fooling many traders. However, a breakout accompanied by increased volume, as in this case, gives added conviction to a trader going long.
Day Trading Stock Online: Volume
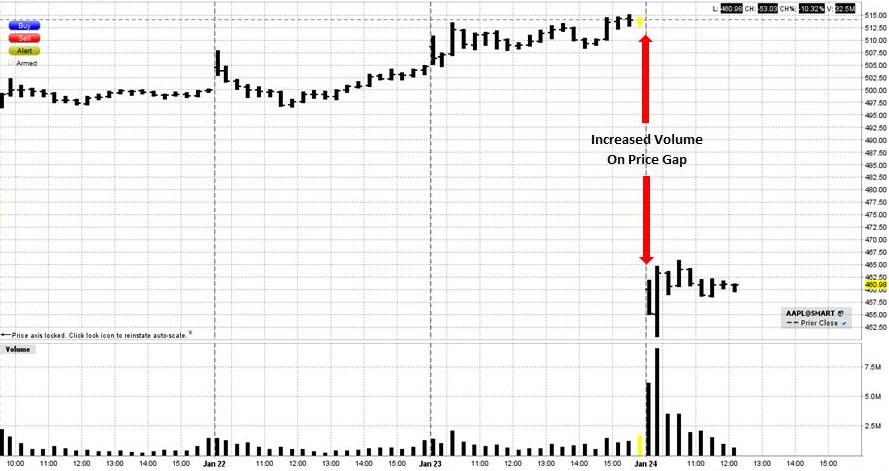
Typically price gaps in either direction are accompanied by strong volume. The gap on the 20 minute bar chart of Apple below occurred after an earnings announcement on 23rd January 2013 reporting the weakest sales in 14 quarters. Gaps in stocks frequently occur on earnings. Volume can shoot up on gaps as traders try to react to good or bad news. However, trading gaps should be done with care. Just because a market gaps up or down doesn’t necessarily mean the market will continue in that direction. It can reverse and fill the gap just as quickly.
Day Trading Stock Online: Volume
In conclusion, volume should be used in combination with other technical analysis indicators. For example, in an uptrend, traders may wait for a pull-back in prices and look for the market to decline to a Fibonacci level on increased volume and combine a Moving Average or Oscillator in anticipating a bottom. An increase in volume if the market begins to advance again indicates conviction amongst buyers in the advance. The same analysis can be used in a falling market.
Volume can be used in trading Stocks, Exchange Traded Funds, Forex, Commodities, Bonds, Futures, etc. Traders should always implement appropriate risk management and stop loss strategies.
Return to Top of Day Trading Stock Online: Volume