Forex
Free Online Trading
Fibonacci Retracements
ForexFreeOnline Trading: Fibonacci retracements are a very popular technical analysis technique applied to all markets including Stocks, Commodities, ETFs, Forex, Bonds, Futures etc. This technique can also be applied in all time frames be it intra-day, daily, weekly, monthly or yearly.
Fibonacci was a 13th century mathematician who is reputed to have discovered a sequence of numbers that occur throughout nature. The numbers appear in flowers like daisies and sunflowers, beehives, architecture, the human body and even financial markets. The sequence is arrived at by adding any Fibonacci number to the previous one.
0 + 0 = 0
0 + 1 = 1
1 + 0 = 1
1 + 1 = 2
2 + 1 = 3
3 + 2 = 5
5 + 3 = 8
8 + 5 = 13
13 + 8 = 21
21 + 13 = 34
34 + 21 = 55
55 + 34 = 89
89 + 55 = 144
The Fibonacci sequence, therefore, is 0, 1, 1, 2, 3 5, 8, 13, 21, 34, 55, 89, 144 and so on for infinity. From the traders point of view it is the ratios that arise from these numbers that are useful.
Any Fibonacci number divided by the previous number is approximately 1.618, otherwise known as the “Golden Ratio” or Phi. The larger the number the closer it gets to 1.618.
55 ÷ 34 = 1.6176, 89 ÷ 55 = 1.6181, 144 ÷ 89 = 1.6179
Often used by artists and architects, the golden ratio has been a source of fascination throughout history. The inverse of 1.618 is 0.618.
Any Fibonacci number divided by the next number in the sequence is approximately 0.6180. The larger the number the closer it gets to 0.6180.
34 ÷ 55 = 0.6181, 55 ÷ 89 = 0.6179, 89 ÷ 144 = 0.6180
Any Fibonacci number divided by the number two places ahead in the sequence is approximately 0.3820. The larger the number the closer it gets to 0.3820.
21 ÷ 55 = 0.3818, 34 ÷ 89 = 0.3820, 55 ÷ 144 = 0.3819
Any Fibonacci number divided by the next number three places ahead in the sequence is approximately 0.2360.
13 ÷ 55 = 0.2363, 21 ÷ 89 = 0.2359, 34 ÷ 144 = 0.2361
The ratios are expressed as percentages - 23.6%, 38.2%, and 61.8%. These Fibonacci levels are frequently used to identify levels at which the market may find support during a correction in an uptrend or resistance during a rally in a downtrend. Charting software with the Fibonacci feature also includes the 50% level because it is also a frequent level of support and resistance.
Fibonacci retracements, therefore, are a leading indicator because it is attempting to highlight possible turning points in the market in advance. It is worth reviewing the webpages about Measured Moves and Swing Trading to aid understanding of Fibonacci retracements.
Understanding Fibonacci is much simpler just by observing the phenomenon in action on a chart. Examine the daily candlestick chart of the EUR/USD currency pair below. The market made a significant top in early May 2011 at 1.4939. A significant bottom formed at 1.3149 in early October. When the market begins to rally in price, traders overlay the Fibonacci levels on the chart to try and predict possible levels of resistance from which the market will resume its downtrend. The market rallied exactly to the 61.8% level from which it declined abruptly. So the rally was exactly 61.8% of the whole range down from early May to early October.
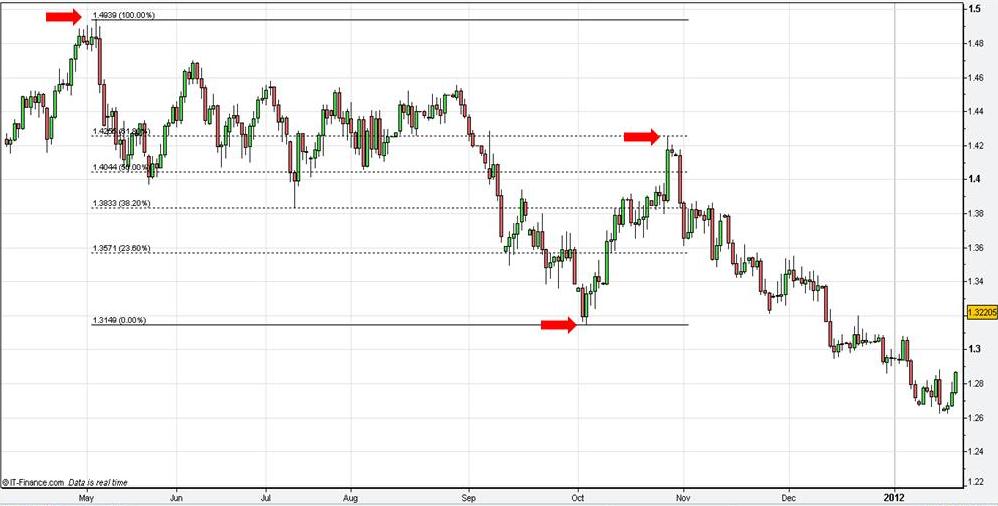
Forex Free Online Trading: Fibonacci Retracements. View charts in interactive mode at ProRealTime.com.
The question remains as to how traders will know at which level the market will react. They don’t. As with all indicators, sometimes they work and sometimes they don’t. Sometimes a level will work temporarily, fail on a retest of that level before moving onto the next one. However, these levels are so widely observed, used and work frequently enough to justify watching them for potential opportunities to go short. Typically traders will use other confirmation indicators in conjunction with Fibonacci. For example, as the market rallies to a Fibonacci level, use an oscillator such as the RSI, Stochastic, Williams %R etc to see whether they indicate the market is overbought. Others may use a moving average as well. If the level is at the same price as a Moving Average it serves as further confirmation. Increased volume as the market reacts at a level can also be a signal.
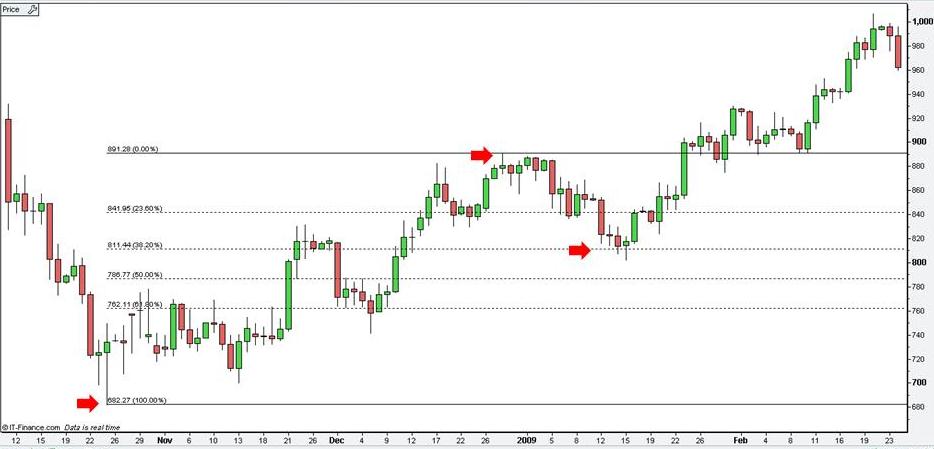
The next chart is a daily bar chart of the same EUR/USD with the subsequent market action included. Observe how the market decline from the 1.4243 level in late October to 1.2622 in mid-January. Once again the market has provided a significant top and bottom upon which the Fibonacci levels can be overlaid. The market rallied to the 38.2% level where it met temporary resistance before advancing to the 50% level before falling away again.
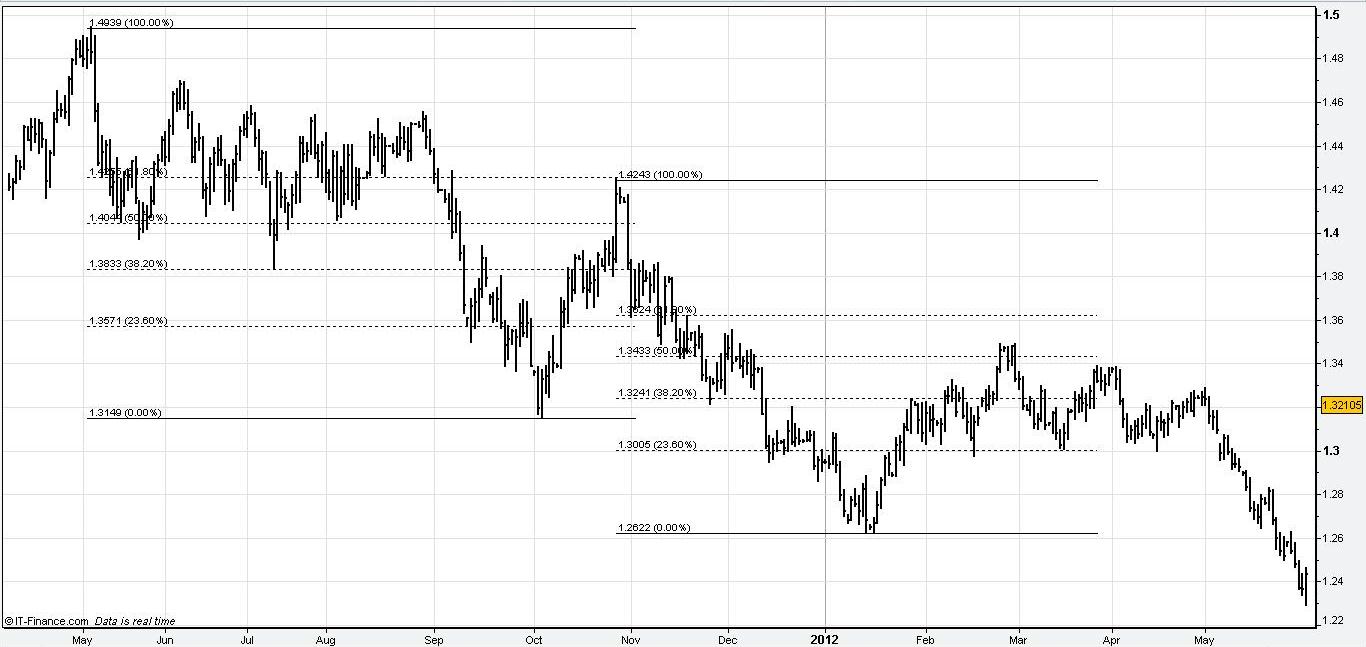
Forex Free Online Trading: Fibonacci Retracements
The market need not react exactly at a level for it to work. Prices can become volatile at a Fibonacci retracement level, perhaps attempting to break through on a number of occasions but not manage to close past it. So, as in the previous chart, the price action may stall and fluctuate around a level before eventually changing direction.
The next example of the USD/JPY currency pair speaks for itself. A major low forms in mid-January 2005 and rallies for nearly a year to form a major top in early December. Initially the market bounces dramatically off the 38.2%. The rally petered out in May and prices declined rapidly to the 61.8% level from where it rallied strongly again.
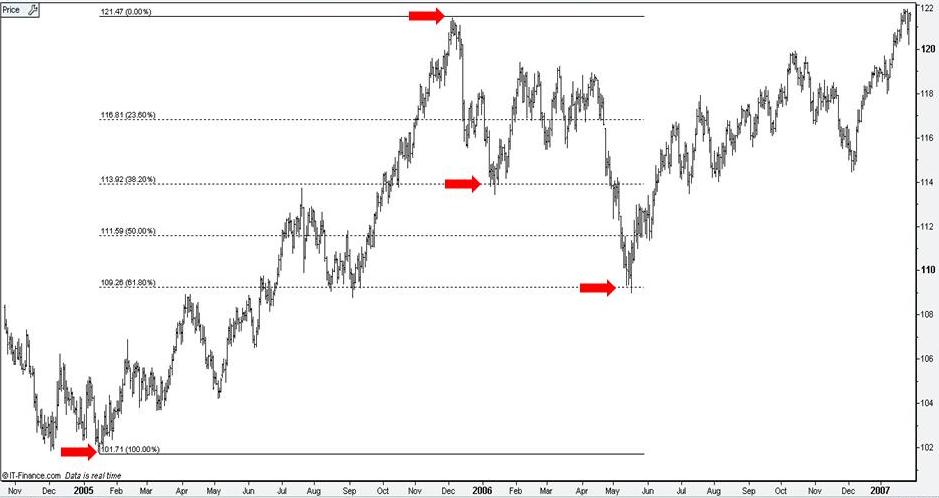
Forex Free Online Trading: Fibonacci Retracements
Fibonacci levels can also be applied to shorter time frames and intra-day trading. The next chart is a 15 minute candlestick chart of the EUR/GBP. Observe how the market reacted at the 38.2%, 50% and 61.8% levels.
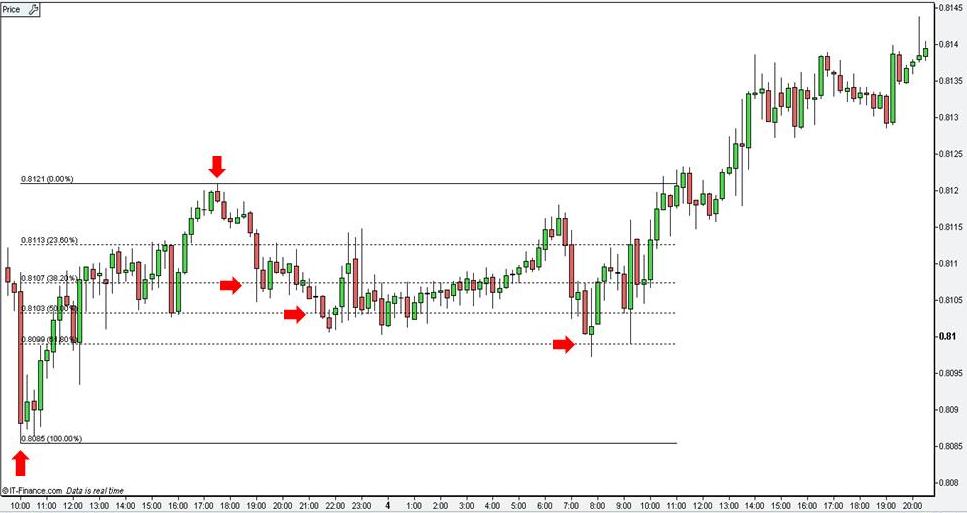
Forex Free Online Trading: Fibonacci Retracements
These levels can be applied to all markets. The next example is a daily candlestick chart of the Gold commodity market. In this instance the market received initial support at the 38.2% level before resuming its rally.
Forex Free Online Trading: Fibonacci Retracements
Return to Top of Forex Free Online Trading: Fibonacci Retracements