Williams %R
Day
Forex Trading Training
DayForex Trading Training: Williams %R was developed by Larry Williams and is an oscillator similar to the RSI, MACD and Stochastics. Oscillators can indicate when a market is overbought or oversold. It measures whether prices are relatively low or relatively high compared to where they have been in the recent past. Like the stochastic it shows the relationship of the close relative to the high-low range over a given period of time. The nearer the close is to the top of the range, the nearer to zero the indicator will be. The nearer the close is to the bottom of the range the nearer to -100 the indicator will be. Typically, Williams %R is calculated using 14 periods and can be used on intraday, daily, weekly or monthly data. In fact it is just the inverse of the Fast Stochastic. The line is the same but the scale is different. The upper and lower bands for %R are usually set at -20 and -80.
The interpretation of %R is similar to other oscillators. Above -20 indicates the market is possibly overbought. When the market crosses back below this line some traders use this as a sell signal. Below -80 markets may be oversold and a move above that level is a buy signal. Bullish and bearish divergences are also interpreted as buy or sell signals.
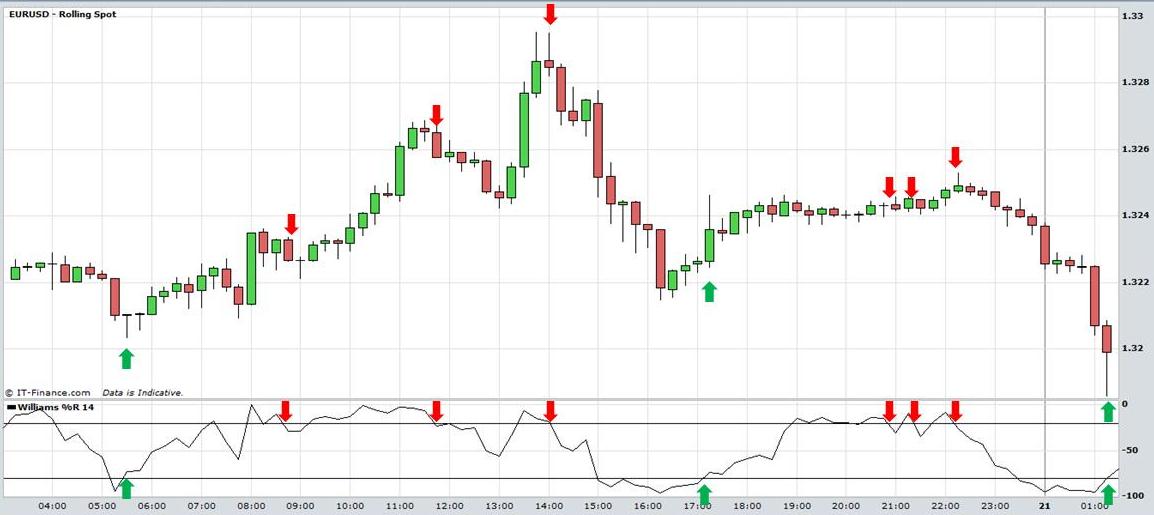
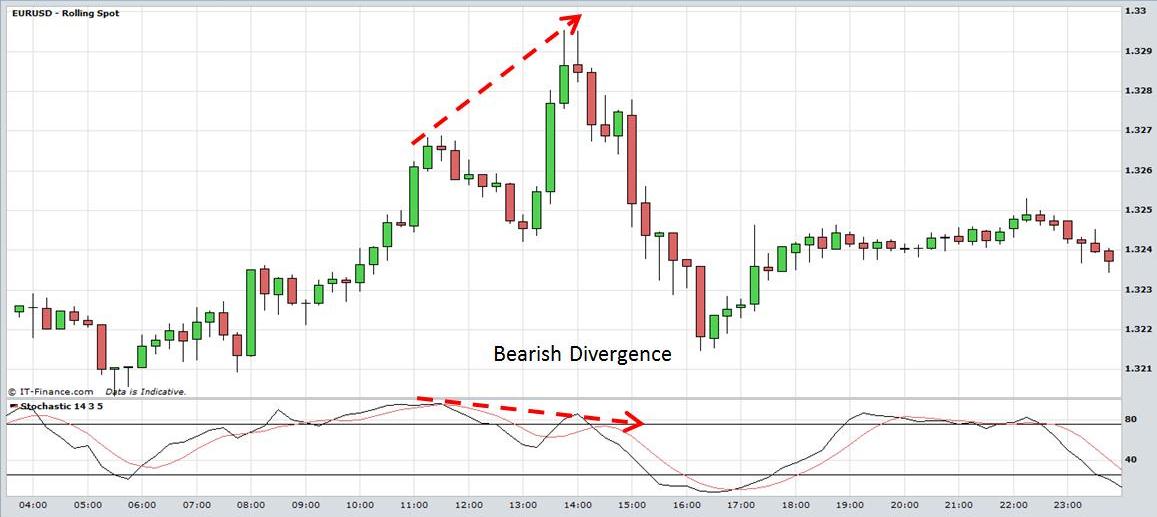
Observe in the intraday candlestick chart
of EUR/USD below how the market often changes direction when the -80 or -20
line is crossed by the %R line. Traders may use this indicator when the market
is trading in a range. When prices
approach the top of the range they look for the indicator to signal overbought
levels and go short. When prices approach the bottom of the range the indicator may signal
oversold levels. As with all indicators,
it doesn’t work all the time and should be used with other indicators and/or chart patterns as well as risk management and stop loss strategies.
View charts in interactive mode at ProRealTime.com.
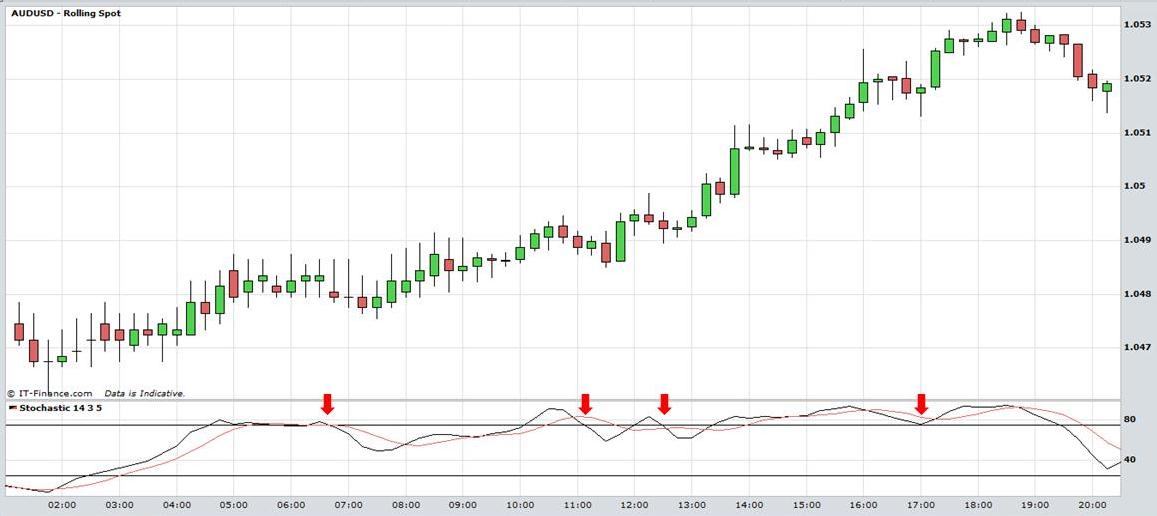
Be aware that in a trending market the market can remain in an overbought and oversold condition for extended periods of time. The chart of AUD/USD below demonstrates how the %R line exhibits many false oversold signals even as the market churns higher.
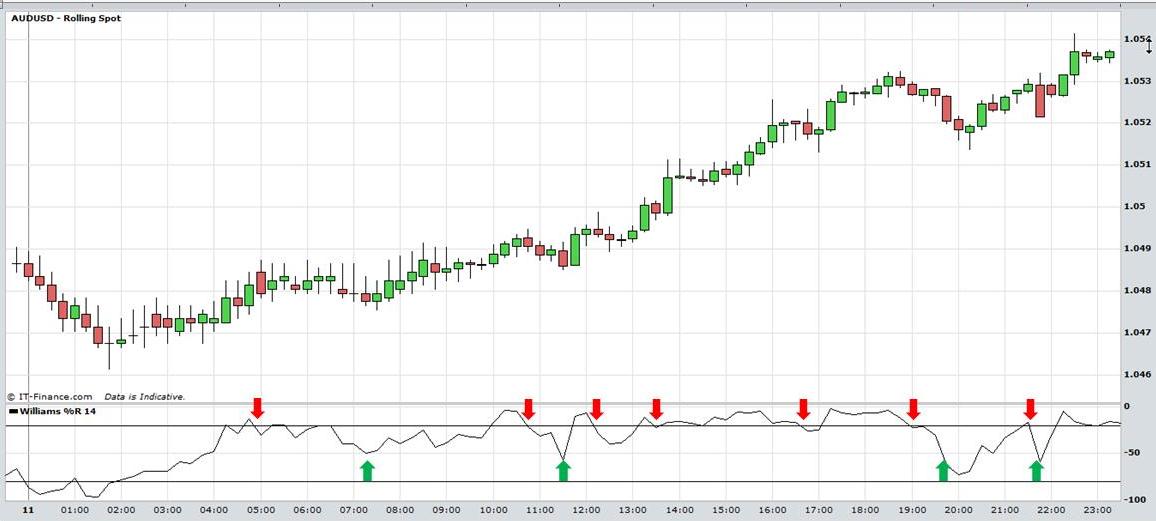
In trending markets traders may make use of the 50 line rather than the upper or lower bands. For example, when the market is trending upwards, traders may buy when prices retreat to the 50 line rather than sell against the trend when the market declines below the -20 line. Examine the chart below and see how the indicator provided buying signals at the 50 line as process made slight declines.
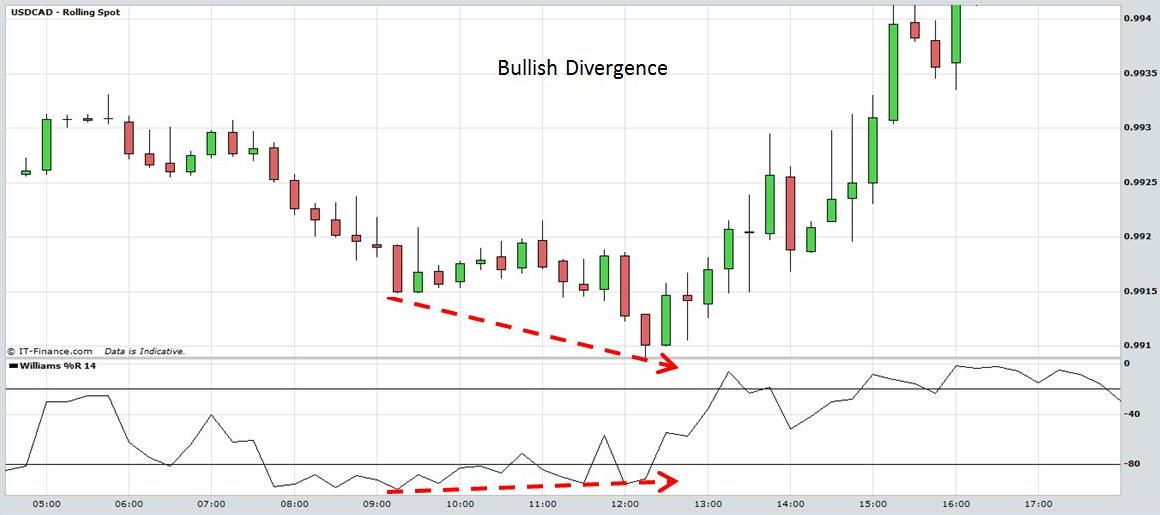
Traders also interpret bullish and bearish divergences as buy and sell signals. For example, in the chart of USD/CAD below the market makes a low at the 0.9915 level accompanied by a low in the %R at 9:15am. Prices form a lower bottom at 12:15pm but the indicator forms a higher low. This is interpreted as a buy signal by some traders because although prices are declining further the %R is indicating that momentum is declining.
Day Forex Trading Training: William %R
The following chart of the GBP/USD demonstrates bearish divergence. Prices form a high at 1.628 accompanied by a high in the indicator. Prices then rally to form a higher top at 1.630 but the indicator forms a lower high. Some traders interpret this as a sell signal.
Day Forex Trading Training: William %R
Williams%R can be used in trading Stocks, Exchange Traded Funds, Forex, Commodities, Bonds, Futures, etc.
Return to Top of Day Forex Trading Training: Williams %R