Forex Online System Trading
Stochastic
Forex OnlinesystemTrading: The Stochastic Oscillator is a momentum indicator developed by George C Lane. It measures the closing price compared to a financial securities high to low range over a selected number of periods. The default setting is usually 14 periods but this can apply to days, weeks, months or intra-day periods.
The idea behind a stochastic is that prices tend to close in the upper part of their trading range when the market is trending strongly upward and in the lower part of the range when prices are in a downtrend. It signifies stronger momentum. The calculation for stochastics is complicated but charting packages perform it automatically.
It is composed of a %K line and a %D line. When the %K line is rising, momentum is increasing and vice versa. The %D line is usually a 3 period simple moving average of the %K line and is used as a signal line. The %K line, is the faster stochastic and because it is more sensitive it will react quicker than the slower %D line. A full stochastic uses a third setting, a simple moving average, which speeds up or slows down the %K line as well.
Like the Relative Strength Indicator, it fluctuates between 0 and 100. The lines at 80 and 20 mark levels at which the market may be overbought or oversold.
The most popular ways to interpret the stochastic are:
- Overbought and oversold levels at the upper and lower bands.
- Crossings of %D line by the %K line
- Bullish and Bearish Divergences.
Examine the intra-day candlestick chart of the GBP/USD currency pair below. When the stochastic is above 80 and crosses below that upper band, traders often interpret this as a bearish signal because the market is overbought. Similarly, when the stochastic moves below 20 and crosses above it again, it is seen as a bullish indicator. Another way of using the stochastic is to interpret the %K line crossing the %D line as buy and sell signals. When %K crosses above %D it’s a bullish signal and when it crosses below %D it is a bearish signal. This may be used by more aggressive traders because it produces buy and sell signals earlier than waiting for the 80 or 20 lines to be crossed.
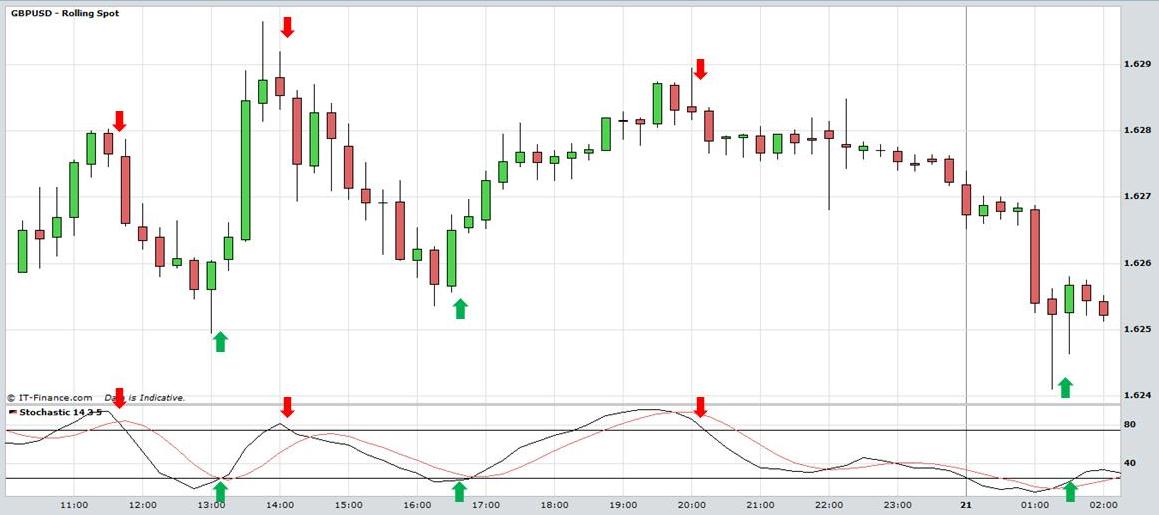
View chart in interactive mode at ProRealTime.com.
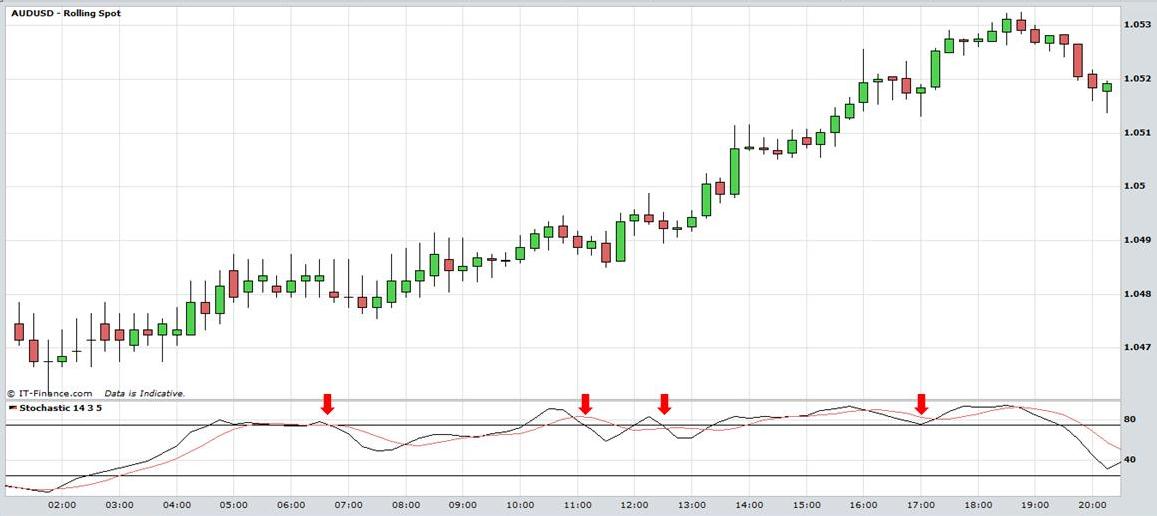
It is not recommended that traders use this as a stand-alone indicator because it can produce many false signals especially in a trending market. When the market is trading in a range, the stochastic can be used as a confirmation indicator to sell or buy when prices are at the top or bottom of a range. In the chart of AUD/USD below the stochastic moves above the 80 line into the overbought area but remains high although the market continues to trend higher. It produces a number of false sell signals during this period. The lesson here is that in a strongly trending market the stochastic can remain in overbought or oversold conditions for extended periods.
Divergences are a further way of using the stochastic. This occurs when the stochastic and prices are moving in opposite directions. In the following intraday chart of USD/CAD prices make a low at 7:30am accompanied by a low in the stochastic. By 11:30am prices form a lower bottom but the stochastic forms a higher bottom. This is a case of bullish divergence and is often interpreted as a buy signal by traders. Although the market is declining further the stochastic indicates that it is losing momentum.
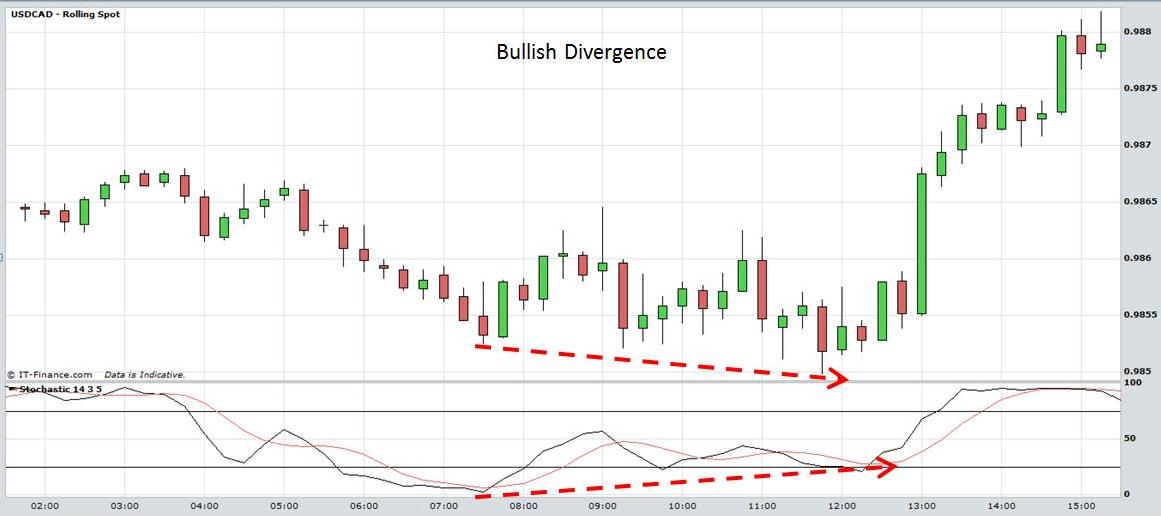
Forex Online SystemTrading: Stochastics. View chart in interactive mode at ProRealTime.com.
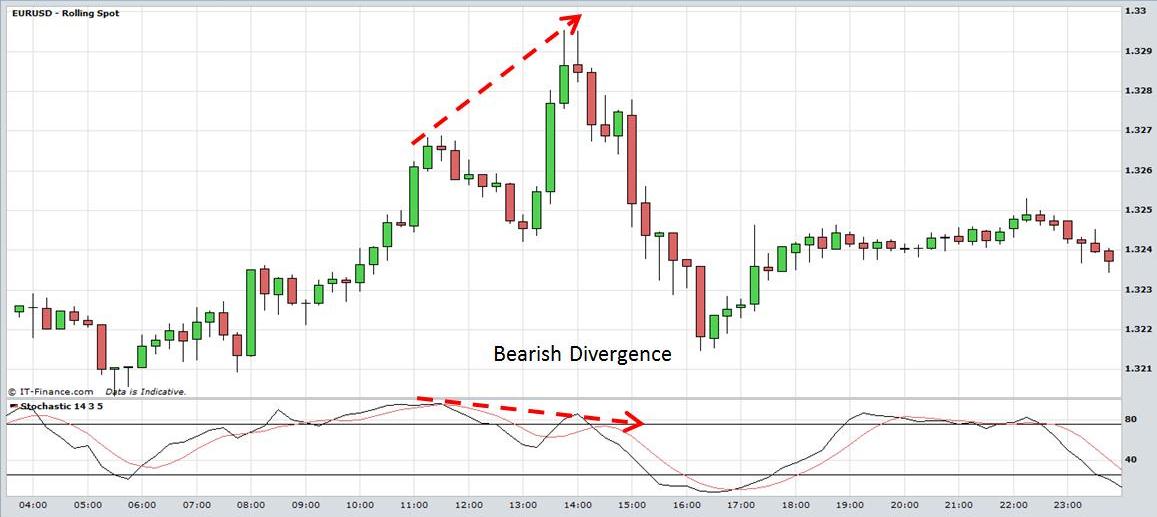
The next example demonstrates bearish divergence. The EUR/USD forms an intra-day high at 11:15am along with a high in the stochastic. Prices form a higher top at 13:45 but the stochastic forms a lower top. Traders often interpret this as a sell signal because the market may be losing momentum despite the higher prices.
Forex Online SystemTrading: Stochastics
Forex Online SystemTrading: Stochastics
Cup and Handle patterns can manifest in Stocks, Exchange Traded Funds, Forex, Commodities, Bonds, Futures, etc. Traders should always implement appropriate risk management and stop loss strategies.
Return to Top of Forex Online System Trading: Stochastics