Day Trading Online
Relative Strength Index
Day Trading Online: The Relative Strength Index (RSI) can be used as a technical analysis indicator in Forex, Stocks, ETFs, Commodities, Bonds, Futures, etc. for day trading or longer term trading. A very popular indicator, it was developed by J. Welles Wilder who also created the Relative Strength Index (RSI), Parabolic SAR (SAR) and Average Directional Index.
RSI is a momentum oscillator that charts the strength or weakness of a financial security based on the closing prices of a recent trading period. It is concerned with the velocity and magnitude of directional price movements. The calculations used compare the size of recent gains of the financial security to the size of its recent losses. RSI is plotted as a line that fluctuates between 0 and 100. Above 70 is considered overbought and below 30 is considered oversold. Divergences between price movement and the RSI are also interpreted as buy or sell signals buy some traders. Although not as strong a signal, some interpret a move above or below the centre of the RSI as a bullish or bearish signal.
Examine the 15 minute intra-day candlestick chart of the AUD/USD currency pair. Each time prices cross the 70 level which RSI indicates as possibly. Similarly when the RSI declines below the 30 level the market turns higher.
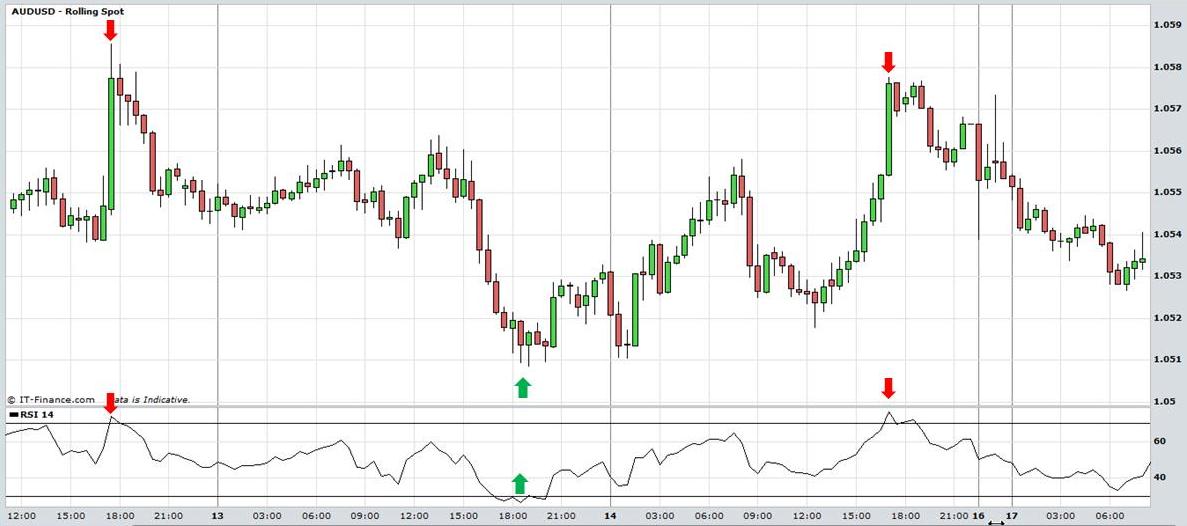
Day Trading Online: Relative Strength Indicator. View chart in interactive mode at ProRealTime.com.
Often these oversold and overbought levels work better with a market that is range trading rather than one that is trending. Traders may use the RSI as a confirmation indicator in a market that is in congestion. For example, if prices reach the top of a range accompanied with a move above the 70 level on the RSI, traders may interpret this as a sell signal. If prices reach the bottom of a range and the RSI simultaneously drops below the 30 level it may be a buy signal for many traders. However, be aware that in a strongly trending market the RSI can remain in overbought and oversold levels for an extended period. Just because the RSI moves above 70 or below 30, it is no guarantee that the market will reverse direction immediately.
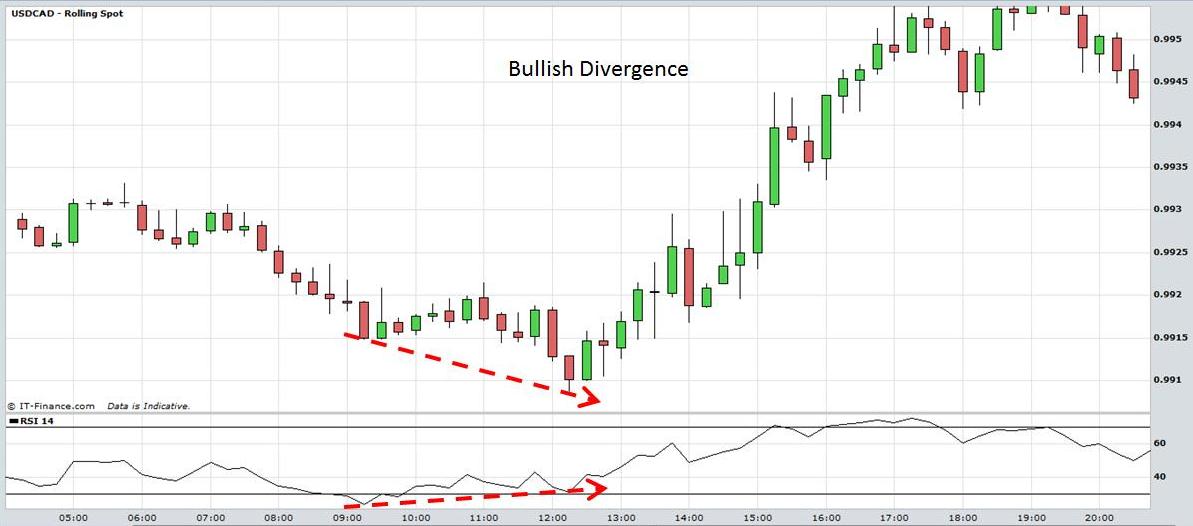
Bullish and Bearish divergences are another way of interpreting the RSI. Examine the 15 minute intra-day chart of USD/CAD currency pair. This is an example of bullish divergence using the RSI. Prices form a low around 9:15am and the RSI drops below 30. However, when prices decline to make a new low at 12:15pm it is not matched by a new low in the RSI. In fact the RSI forms a higher bottom. This is an indication that the downward price movement is running out of momentum and prices rapidly advanced from this level. Traders observing bullish divergence often use this as a buy signal.
Day Trading Online: Relative Strength Index
Bearish divergence can be interpreted as a sell signal. The daily chart of the GBP/USD currency pair below demonstrates this. Prices form a top at 1.858 and the RSI surges above the 70 level. The market then advances to form a higher top at 1.9143 but the RSI forms a lower top and bearish divergence. Traders using the RSI often interpret this as a sell signal. Prices did decline significantly following this signal.
Day Trading Online: Relative Strength Index
Traders should always implement appropriate risk management and stop loss strategies when using RSI.
Return to Top of Day Trading Online: RSI