Online Trading Academy
Average Directional Index
Online TradingAcademy: Average Directional Index (ADX) is a momentum indicator designed by Welles Wilder. He also developed the Average True Range, Parabolic SAR and Relative Strength Indicators. ADX measures the strength of the trend rather than the direction. Typically a strong trend emerges when the ADX is above 20 to 25 but below 20 the market tends to settle into a trading range.
ADX is complicated calculation. Two components of ADX are the Plus Directional Movement (+DM) and the Minus Directional Movement (-DM). These two lines indicate the direction of the trend and are also plotted alongside the ADX line.
Plus Directional Movement is calculated by measuring the difference between the current high and the previous high. It is positive because the current high is higher than the previous high. If it was lower it would be a reading of zero. A market that is trending strongly upward will have more days where the current high is higher than the previous high so the +DM line will also move upward.
Minus Directional Movement measures the difference between the previous low and the current low. It is also a positive number because the current low is below the previous low. If it was higher it would also be a reading of zero. A market that is trending strongly downward will have more days where the current low is lower than the previous low so the -DM line will also move upward.
A crossover of +DM above the –DM line, therefore, indicates higher prices. A move of – DM below the +DM line indicates lower prices. Traders may combine crossovers of these two lines with the ADX reading as buy and sell signals.
The best way to become familiar with this indicator is to observe how it behaves on charts of the markets you trade.
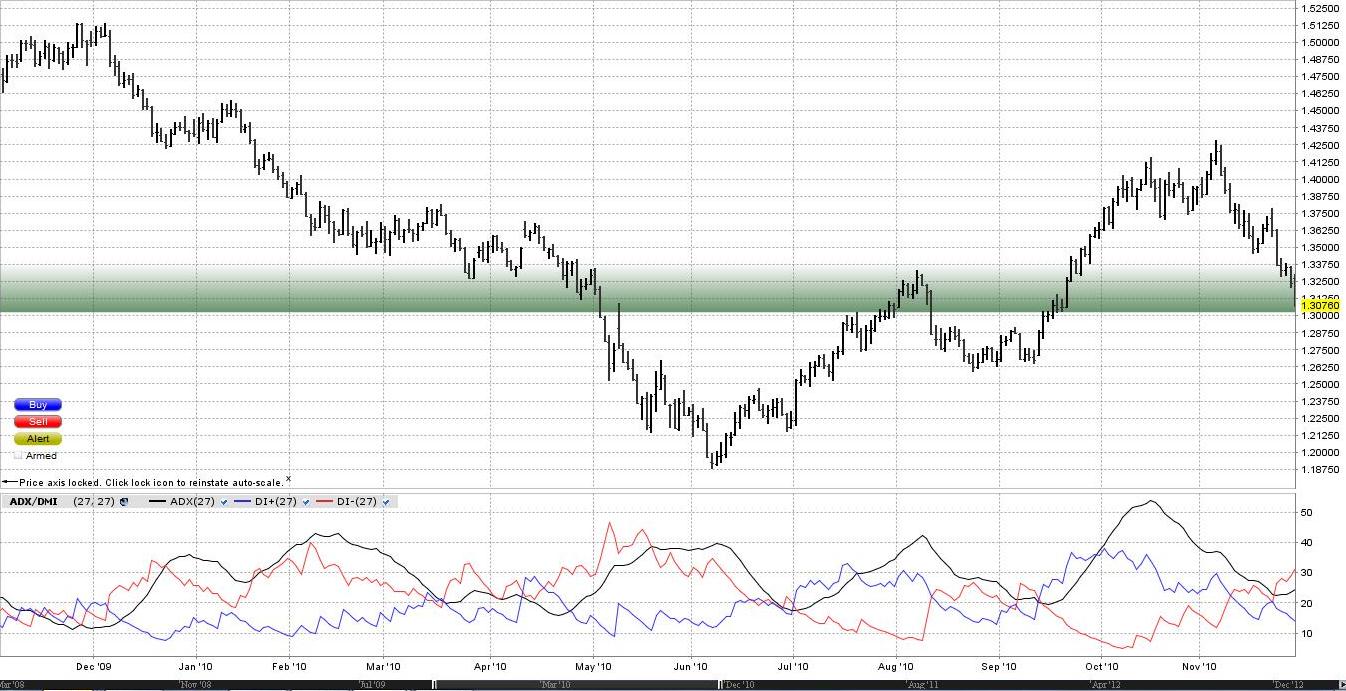
On the charts below the ADX is the black line, +DM is blue and –DM is red. Observe the ADX line on the daily bar chart of the EUR/USD currency pair below. Note how the trend is stronger when the ADX line is above 20. The non-directional nature of the indicator is also apparent. The trend changes rapidly in early June 2010. The ADX dipped below the 20 line before rapidly rising again along with the trend. A reversal of the ADX line from high readings indicates the trend may be losing steam. Traders trading with the trend will be on alert for a potential reversal.
Crossovers of the +DM and –DM lines can also signal a change in price direction. In December 2009 the –DM line crossed above the +DM line indicating lower prices. Prices did decline for the next three months. However, crossovers can occur quite frequently producing false buy or sell signals. They should be used with other analysis such as trend lines, moving averages and chart patterns. Otherwise traders will find themselves being whipsawed out of their trades. In July and September +DM crossed above –DM and prices also rose significantly. If these crossovers occur when the ADX line has risen above the 20 line it signals more conviction in the mov
Online TradingAcademy: Average Directional Index
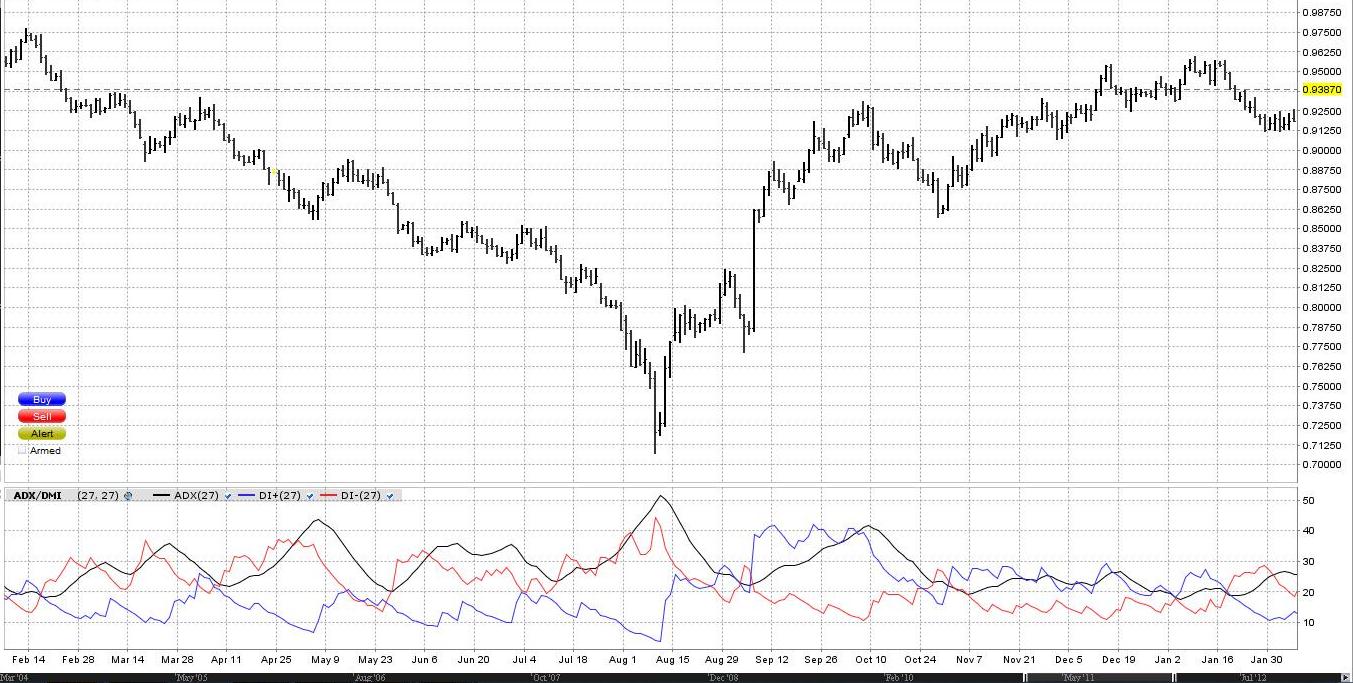
The next chart is of the
CHF/USD currency pair. Once again the ADX line remained above 20 during the
extended downward trend from February to August. It peaked above 50 in August
before a dramatic reversal and rally in prices. As the ADX crossed over 50
traders long in the market would be on high alert for a reversal in the ADX
line indicating an end to the trend. Note how the indicator flatlined around
the 20 region as the upward trend of the market weakened and settled into a
phase of consolidation from November onwards.
Online TradingAcademy: Average Directional Index
Online TradingAcademy: Average Directional Index
ADX is known as a lagging indicator. It uses past prices in its calculation so it will lag the market. Because of this it is used more as a confirmation indicator rather than a signal to buy or sell. For traders who only like to trade with the trend it can help to keep them in the market during a strong trend or avoid trading when the ADX is weak. For example, a market may go into a period of consolidation for weeks to months. Many traders have no interest in markets that do so. However, if the ADX begins to rise along with an upward breakout in prices it could be a good buying opportunity. They may decide to take a long position and try to hold it as long as the ADX is rising by implementing a trailing stop loss strategy. Although Wilder developed the indicator for Commodities it can be used on other financial instruments such as Stocks, Exchange Traded Funds, Currency Futures / Forex and Bonds.
Return to Top of Online TradingAcademy: Momentum Indicators