Average True Range
American Futures Trading
Average True Range (ATR) is an indicator that can be applied to American Futures Trading and all financial markets including Stocks, Exchange Traded Funds, Forex, Commodities, Bonds, etc. ATR measures volatility. It is not designed to indicate the direction of the market. The ATR was developed by Welles Wilder. He also designed the Relative Strength Index (RSI), Parabolic SAR (SAR) and Average Directional Index.
Knowledge of a market's volatility is important for traders because they will know what a “normal” market behaves like as opposed to a market that is more volatile than usual. It can also help with developing an effective stop loss strategy.
Take, for example, two stocks that are trading at $50. Stock A moves on average $1 dollar a day. Stock B moves on average $3 a day. Stock B is clearly more volatile and will require a stop loss order that is further away than Stock B. A stop loss that is $2 away is more likely to get hit on Stock B than Stock A. Knowing the Average True Range of a stock provides vital information about its volatility and where to place stops to avoid being taken out of a trade due to daily volatility or noise.
The True Range is the greatest of these three:
- Today’s high minus today’s low
- Today’s high minus yesterdays close (absolute value)
- Today’s low minus yesterdays close (absolute value).
The Average True Range is the exponential average of these values. Typically, the previous 14 periods are used in calculating the ATR and is displayed on the bottom of the chart.
The absolute value is used to ensure a positive number. After all, we are interested in the distance between two points rather than whether it is a positive or negative number. When that distance increases it indicates greater volatility. When the distance decreases it indicates declining volatility.
The value of yesterday’s close is used to account for gaps. The market may have had a quiet, low range day but it may have made a huge gap from the previous day’s close. The ATR accounts for this as it is important information signifying a big move.
Examine the daily candlestick chart of the Dow Jones Futures below. When the market is making narrow range days the ATR gives a low reading. The ATR rises dramatically when volatility increases making wide daily swings. Observe the period from August to October. Credit rating agency Standard & Poor’s downgraded the credit rating of the US federal government from AAA (outstanding) to AA+ (excellent on 5th August, 2011. The fear this engendered resulted in extremely volatile American futures trading with gaps and wide range days on a daily basis for weeks. The ATR went above 300. By February of 2012 the volatility had subsided and the ATR had declined to previous lows around the 100 level.
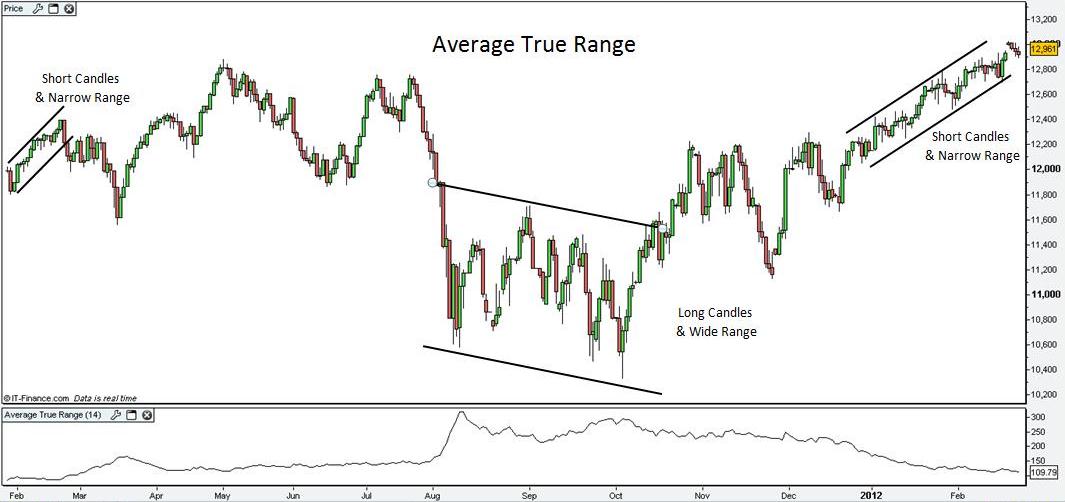
American Futures Trading. View chart in interactive mode at ProRealTime.com.
Markets can become very volatile at tops and bottoms and important trend changes so the ATR may peak out at such times. This is apparent in the ATR on this chart as the lows made in August and October on the Dow Jones Futures Market proved to be a significant change in trend from which the market soared higher.
Return to Average True Range: American Futures Trading
Return to Volatility Indicators