PARABOLIC SAR
STOCK TRADING TRAINING
Stock TradingTraining- Parabolic SAR: The Parabolic SAR was developed by J. Welles Wilder. SAR actually stands for “stop and reverse” and trails the price of a trend. When the trend changes, therefore, it stops and reverses.
It helps traders identify when to enter and exit the market once the trend is known. When the SAR is below the market, traders may be long with a trailing stop loss order at the level of the indicator. When the SAR is above the market, traders should be short with a trailing stop above the market at the level of the indicator. Traders may use it as a confirmation indicator in combination with other technical indicators to help determine the trend and implement an effective stop loss and risk management strategy.
In a rising market the SAR is highlighted with a green dot underneath the bar of the time frame under analysis. In a falling market it is highlighted with a red dot. The mathematics for calculating this indicator are complex but are explained in Wilder’s book, New Concepts in Technical Trading Systems.
Charting packages with this indicator allow changes to be made to how SAR is calculated. Known as the Step it relates to the acceleration of the indicator. Essentially, changes to the step increase or decrease the sensitivity of the SAR. There are no one set figures to input and they may vary depending on the underlying security. Traders must experiment with the settings on their chosen financial market to determine the best ones. One approach is to go back over past trends and check what setting would have produced the best results. The next time that market begins to exhibit evidence of a trend then applying the same settings may produce an effective trailing stop loss strategy and healthy profits.
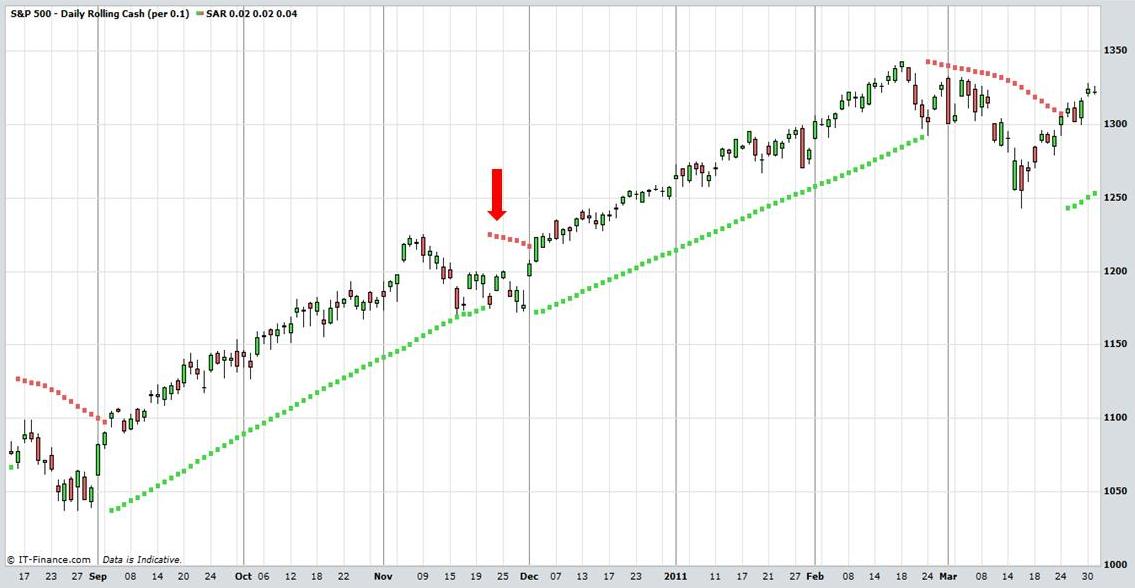
Examine both daily candlestick charts of the S&P500 index below. In the first chart the SAR remains under the trend from September 2010 to March 2011. A trader long this market would have been protected with a stop loss on the SAR during this entire period. In the next chart the settings of the SAR have been changed and are now more sensitive to price movement. Because of this a trader with a long position at the start of the trend would have been stopped out in November because the SAR reversed and the trailing stop loss would have been hit.
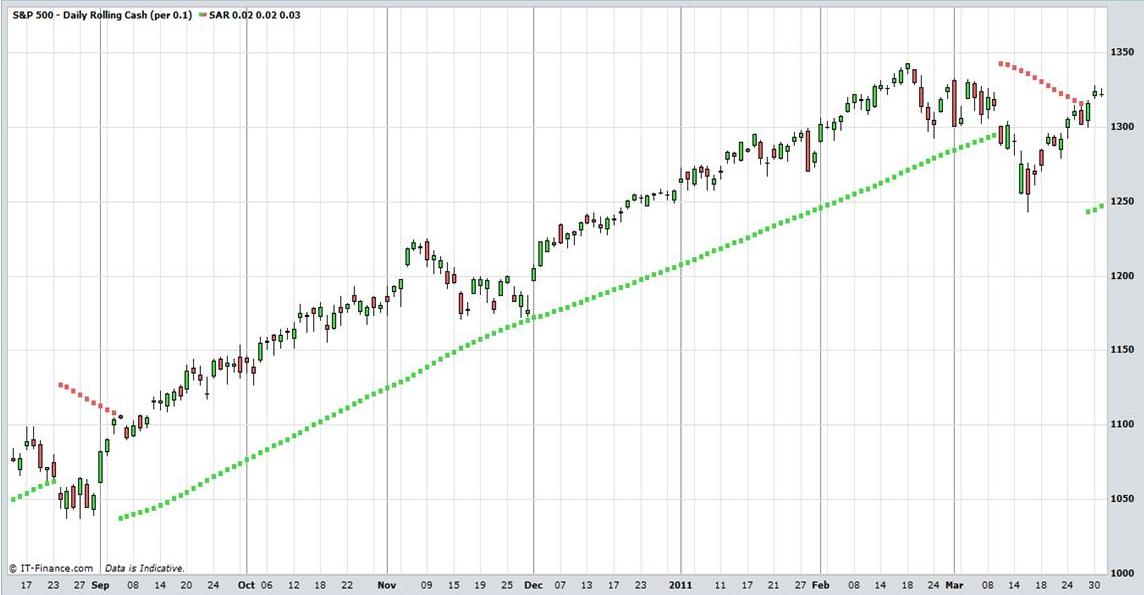
Stock Trading Training: Parabolic SAR. View charts in interactive mode at ProRealTime.com.
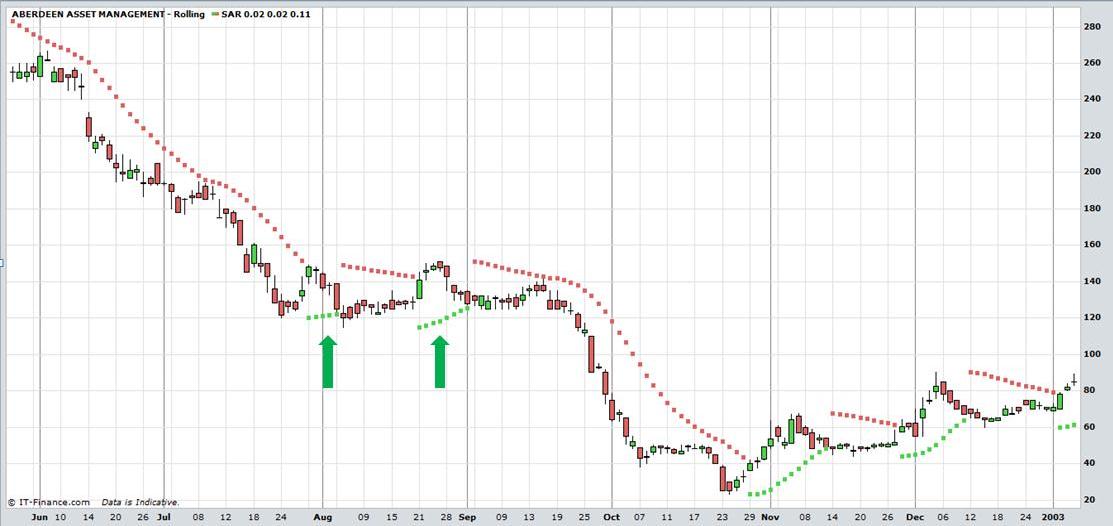
The next two charts demonstrate the same principle but in a falling market. Aberdeen Asset management declined from June to December. In the first instance the SAR worked throughout the entire period. In the second chart the trailing stop loss was hit in late July. This is because the SAR is more sensitive in the second chart.
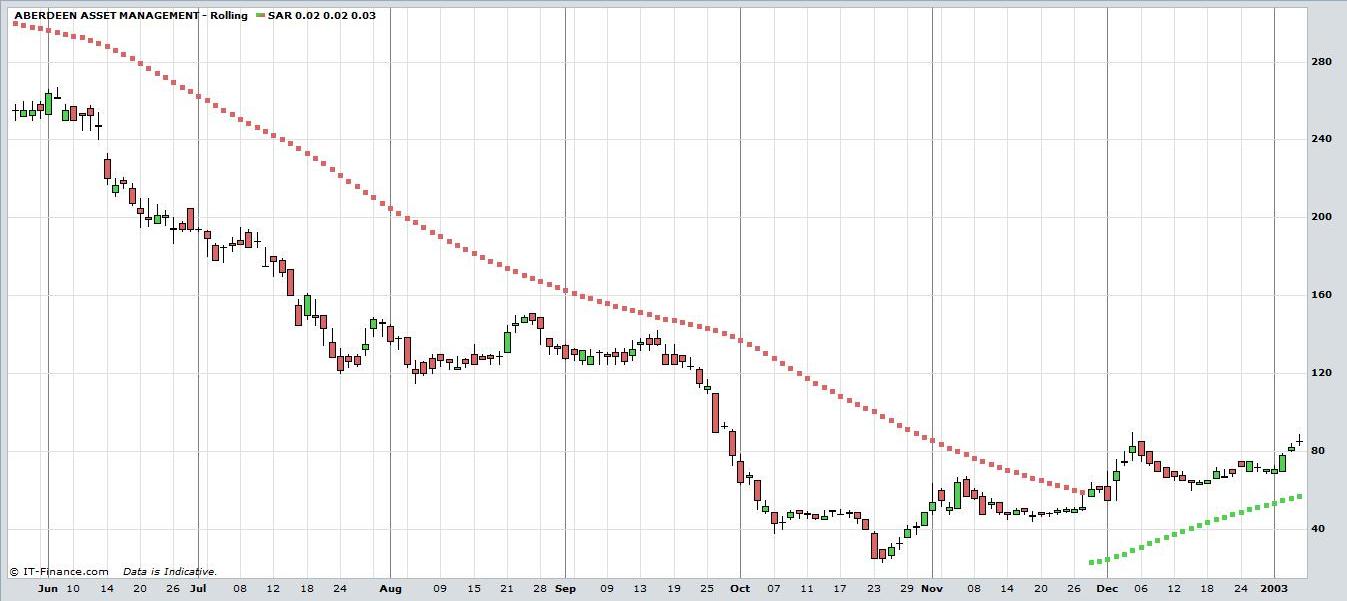
Stock Trading Training: Parabolic SAR.
It is important, therefore, for a trader to experiment with the SAR to get the optimal settings. Remember that the less sensitive the SAR is, the less likely a stop loss will be hit by price movements against the trend. However, it also means that a trader is taking on more risk. The loss will be greater if the market does change trend significantly because the stop loss is further away from the price action. It is up to the trader to decide on the balance to be struck.
Finally, the Parabolic SAR is more suitable for a trending market rather than one in congestion, trading in a range. The reason for this is that the indicator will produce too many entry and exit signals resulting in a trader being whipsawed out of the market. See the chart below of the EUR/USD as an example.
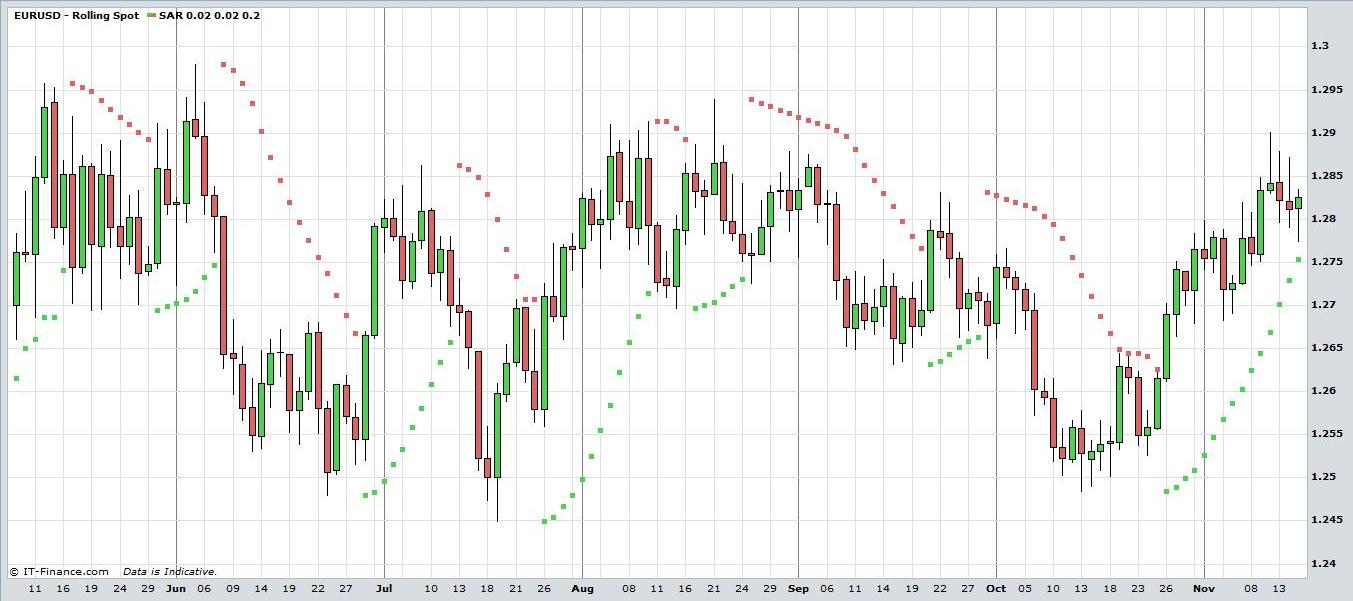
Stock Trading Training: Parabolic SAR. View chart in interactive mode at ProRealTime.com.
Cup and Handle patterns can manifest in Stocks, Exchange Traded Funds, Forex, Commodities, Bonds, Futures, etc. Traders should always implement appropriate risk management and stop loss strategies.
Return to Top of Stock Trading Training: Parabolic SAR