Bollinger Bands
Futures Currency Trading
Bollinger Bands are an indicator often used in futures currency trading or any financial market. Developed by John Bollinger they help gauge the volatility in the market as well as how high or low prices are relative to recent prices. In a trending market the bands will widen but in a range trading market they will contract. A more volatile market will also result in widening bands.
This indicator has three bands, an upper, lower and centre band. The centre band is a simple moving average, typically a 20 period one. The upper and lower bands represent a two standard deviation movement in price from the moving average. In statistical studies, this setting means that prices should remain within the band 95% of the time.
Examine the chart of the USD/CAD currency pair below. The Bollinger Bands are narrow when the market is trading in a range from February to April. 2012. The bands widen as the market breaks out to the uptrend.
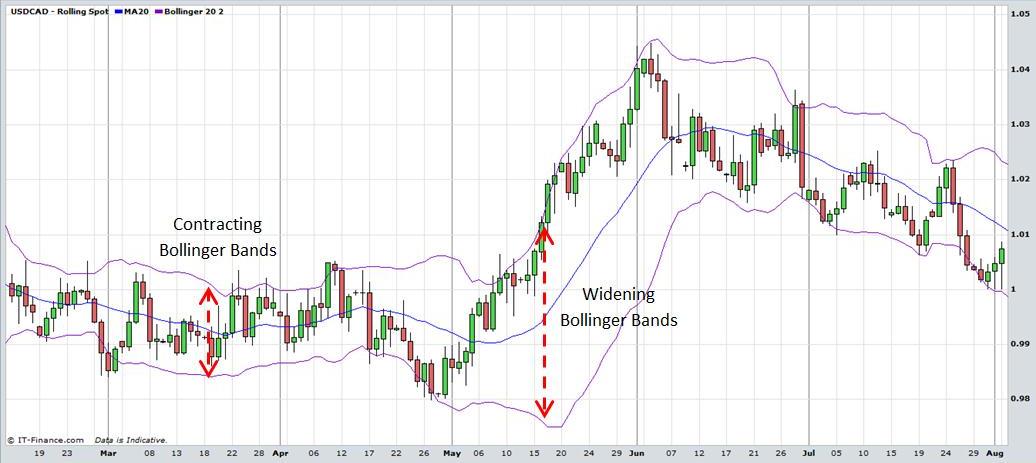
Futures Currency Trading: Bollinger Bands. View chart in interactive mode at ProRealTime.com.
In a range trading market some traders use the Bollinger as a confirming indicator to sell or go short when prices reach the upper band and buy when they reach the lower band. Reversals often occur near the upper or lower bands.
This may work when prices are in congestion but should not be attempted when the market breaks out of the range. When the market trends upwards prices tend to hug the upper band and the lower band in a downward trending market. Trend reversals may occur near the upper or lower bands but shorting the market in an upward trend just because prices hit the upper Bollinger Band is a recipe for disaster. For example, the trend can remain upwards for an extended period of time with prices repeatedly hitting or even exceeding the upper band. Shorting the market each time the upper band is hit could result in significant losses. The same applies to buying in a downward trend. Observe this price action in the chart of the daily candlestick chart of the EUR/USD currency pair below.
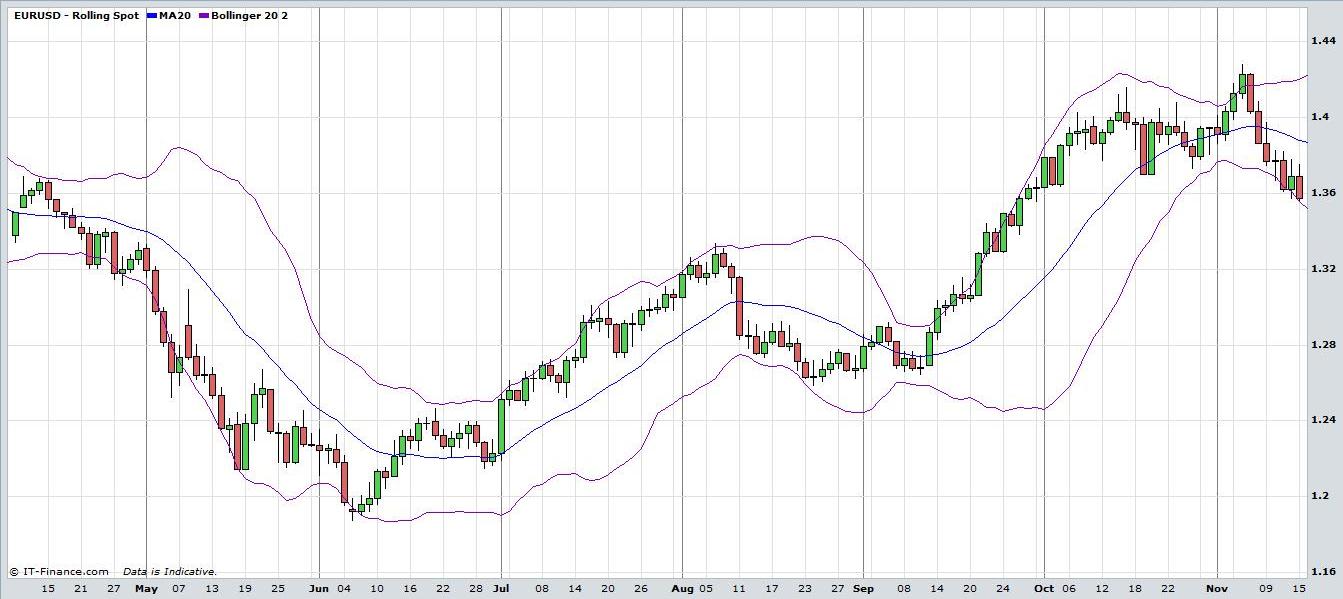
Futures Currency Trading: Bollinger Bands. View chart in interactive mode at ProRealTime.com.
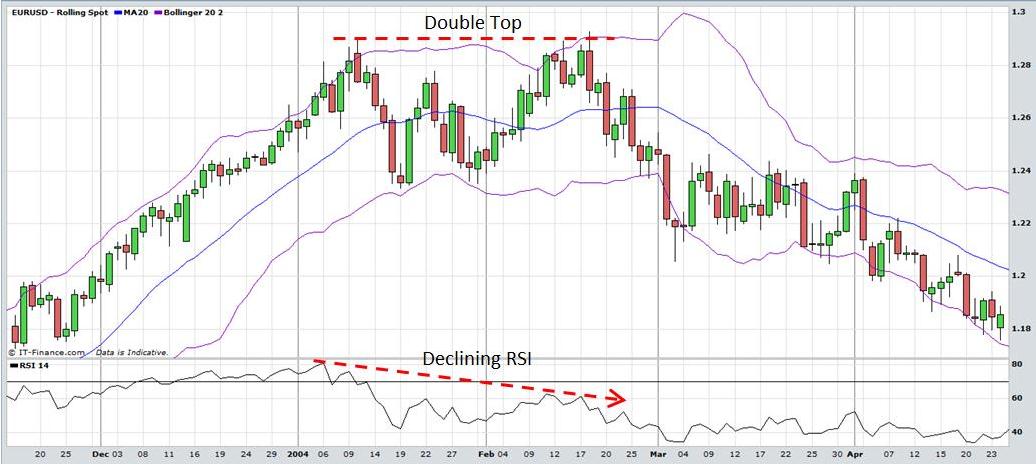
Bollinger Bands, therefore, are not a stand-alone indicator but should be used with other analysis as confirmation. The next chart demonstrates how a trading strategy can be developed using Bollinger Bands in conjunction with the RSI and a chart pattern known as the Double Top. The EUR/USD made a double top around the 1.2900 level. When the market made the second top it also touched the upper Bollinger band. Furthermore, the RSI made a lower top showing that although prices had risen to the previous high, conviction in the move was declining. The fact that there is a chart pattern and two confirming indicators enhance the probability of a trader going short will be correct.
Bollinger Bands can be used in trading Stocks, Exchange Traded Funds, Forex, Commodities, Bonds, Futures, etc. Traders should always implement appropriate risk management and stop loss strategies.
Return to Top of Futures Currency Trading: Bollinger Bands
Return to Volatility Indicators