Online Securities Trading
Money Flow Index
Online Securities Trading – Money Flow Index (MFI): This indicator measures the flow of money into and out of a stock and is calculated using price and volume. It is an oscillator that is plotted on a scale of 1 to 100. Below 20 indicates the market may be oversold and due for a rally. Above 80 indicates the market may be overbought and due for a retracement. By combining volume and price action it provides information about market sentiment. In talking about money flow, remember that for every buyer there is a seller so actual money flow balances out at the end of the day. However, a high closing price represents stronger buying pressure while a weak closing price represents stronger selling pressure. Charting packages calculate MFI automatically but the formula is as follows:
Step 1: Typical Price = (High + Low + Close) / 3
Step 2: Raw Money Flow = Typical Price x Volume
Step 3: Money Flow Ratio = (14-Period Positive Money Flow) / (14-Period Negative Money Flow)
Step 4: Money Flow Index= 100 – 100/ (1 + Money Flow Ratio) Essentially,
Money Flow Index is also known as a volume-weighted Relative Strength Index. Essentially it compares the total trading values of days where there is positive price action with to the total trading values traded on days with negative price movement. 14 days is usually standard.
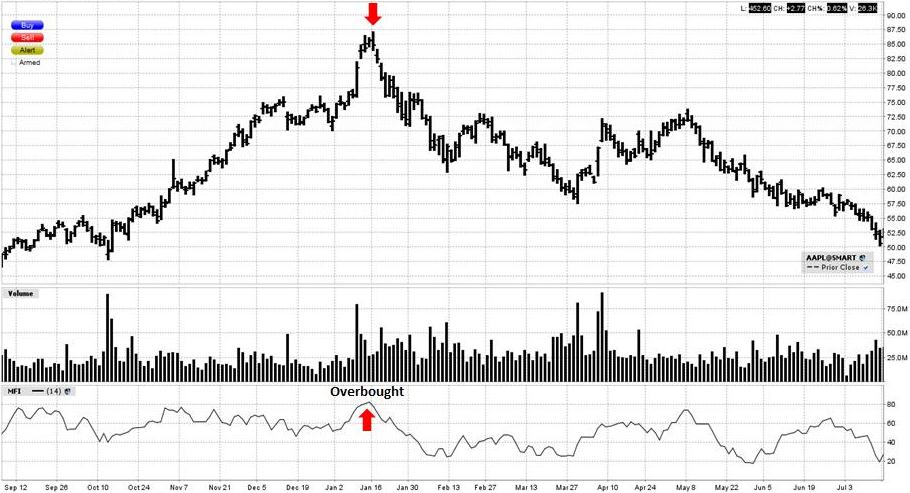
Examine the daily bar chart of Apple below. The market was in a strong upward trend from September to January. In-mid January the MFI crossed the 80 line indicating that Apple shares may be overbought. The market almost immediately changed to a downward trend until July. Be aware that stocks can remain in overbought and oversold levels for extended periods of time and other analysis should be used to confirm your view.
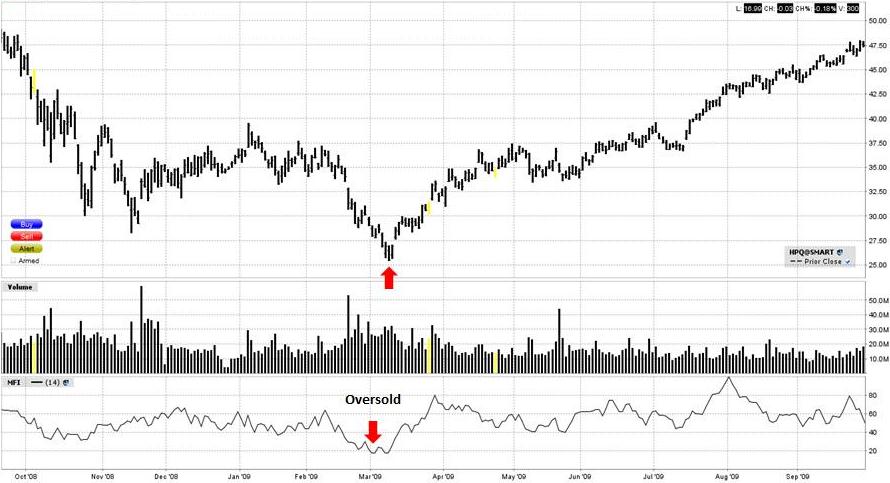
The next chart of Hewlett Packard was in a downtrend for five months. In early March the indicator crossed the 20 line indicating that Hewlett Packard shares may be oversold. Shortly after, the market rallied for seven months.
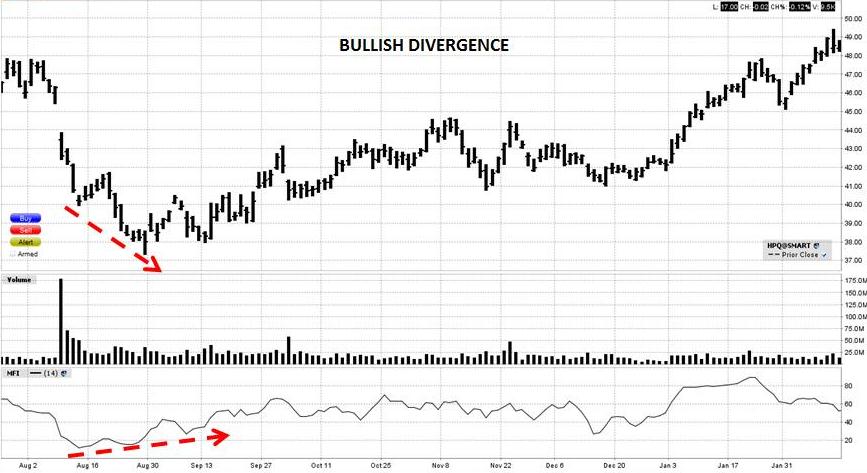
Bullish and Bearish Divergence is also a frequently employed indicator by traders. Bullish divergence occurs when prices make a new high but the MFI does not correspond. For example, in the chart of Hewlett Packard below prices made a low in mid-August, rallied, then declined to form a lower bottom. However, the MFI did not accompany the lower prices, a bullish divergence pattern. This means that although prices are going lower the selling pressure is actually weakening indicating a rally may be due. Shares did recover for the next four months.
Online Securities Trading: Money Flow Index
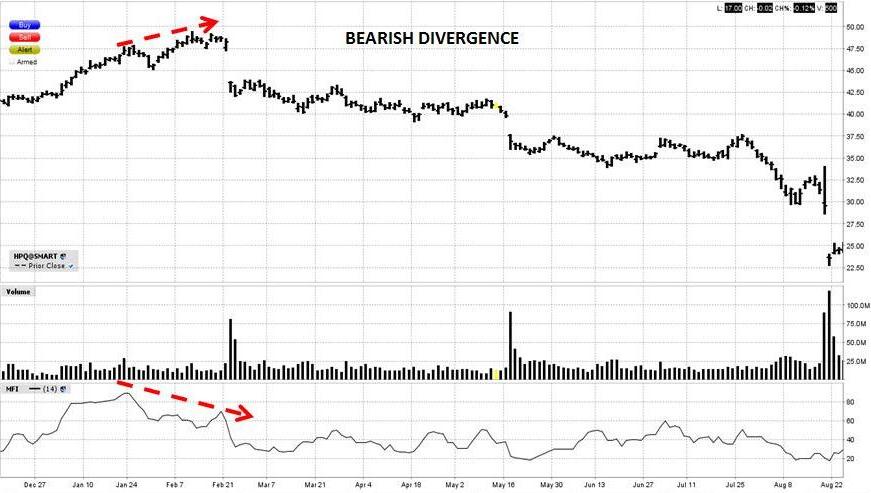
The next chart of Hewlett Packard demonstrates Bearish Divergence. HP shares rallied to make a new top in January, declined, and then rallied to make a higher top in February. However, the MFI exhibited bearish divergence by making a lower top. Traders interpret this as an indication that buying pressure is declining despite the higher prices and a decline in prices is due. HP shares fell for the next six months.
Online Securities Trading: Money Flow Index
MFI is not a stand-alone indicator and should be combined with other technical analysis indicators such as Momentum Indicators, Moving Averages, Fibonacci Retracements and Chart Patterns. It can be used with Stocks, Exchange Traded Funds, Forex, Commodities, Bonds, Futures, etc. Traders should always implement appropriate risk management and stop loss strategies.
Return to Top of Online Securities Trading