Online Trading Advice
On Balance Volume
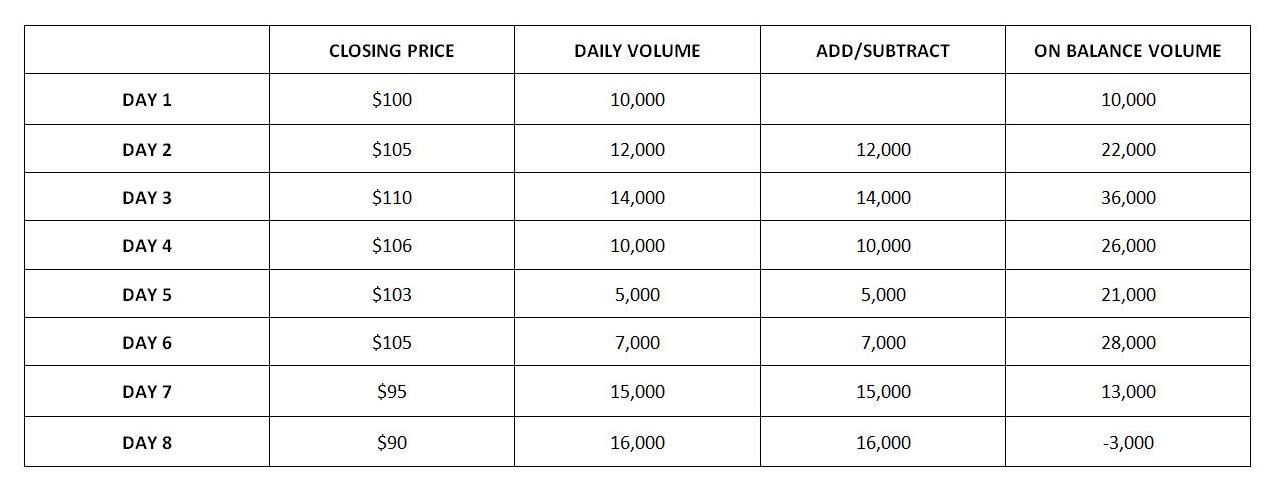
Online Trading Advice: On Balance Volume (OBV), created by Joe Granville, is a simple but useful technical analysis indicator. It combines volume and price to measure the buying or selling pressure in the market. The closing price is the one used in the calculation. If the market closes higher on high volume it suggests that buying pressure is strongest. In this case the OBV line would rise. If the market closes lower on high volume it suggests that selling pressure is strongest and the sellers are on top. OBV measures the cumulative total of volume. If the close is higher than the previous session, the volume is added to the previous total. If the close is lower than the previous session, the volume is subtracted from the previous total.
For example:
On Balance Volume can be interpreted in a number of ways and Granville maintained that volume could indicate the price direction in advance. In particular, traders look for bullish and bearish divergence.
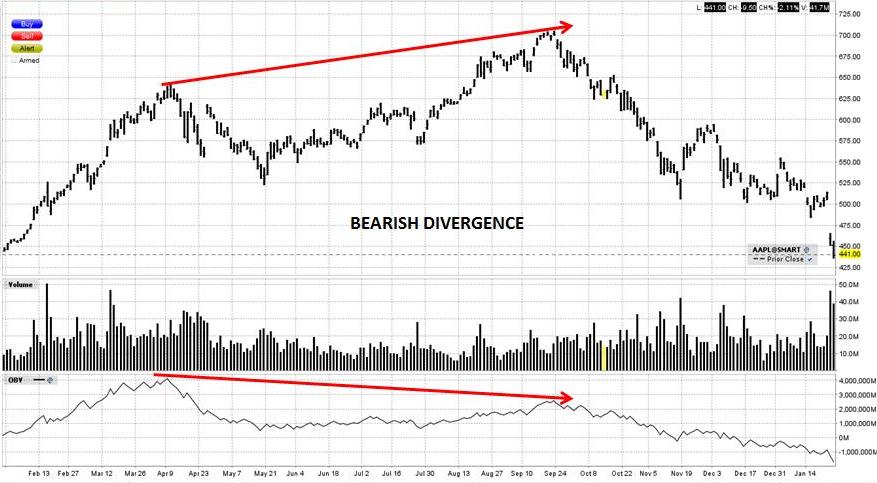
The daily bar chart below of Apple made a high in early April accompanied by a high in the OBV line. In September it made a higher top in price but this was not accompanied by a higher top in the OBV line. This is known as bearish divergence because although prices are rising, volume is exhibiting bearish sentiment. This is often interpreted as an indication of lower prices ahead because buyer interest is declining despite the rising price. Prices did indeed decline sharply after September.
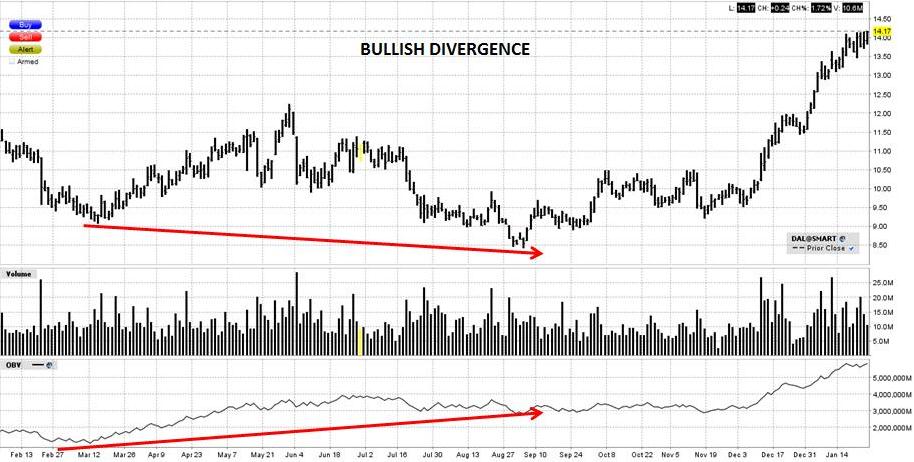
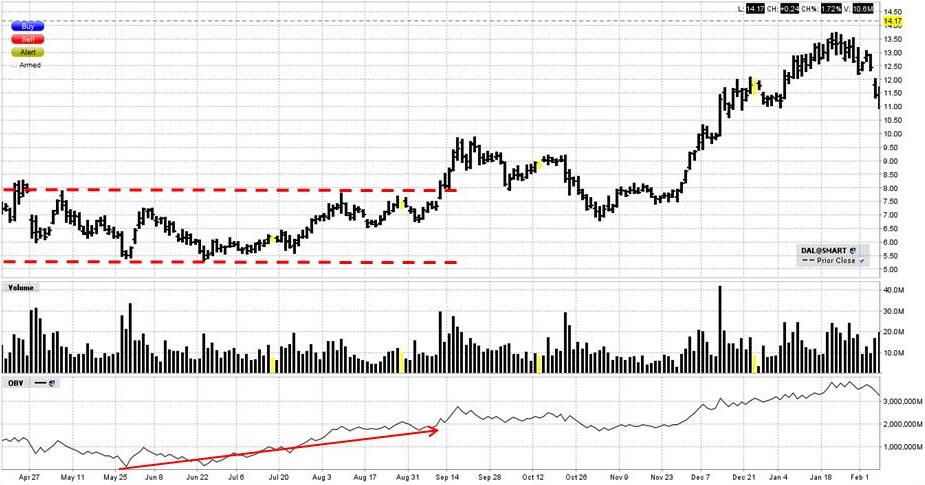
Bullish divergence happens when prices make a lower bottom but the OBV does not decline to new lows. The next chart of Delta Airlines shows how prices formed a bottom in late February, rallied and then declined to make a lower bottom in September. The OBV line remained well above the low made in February. This indicates stronger buying interest than selling interest in that stock.
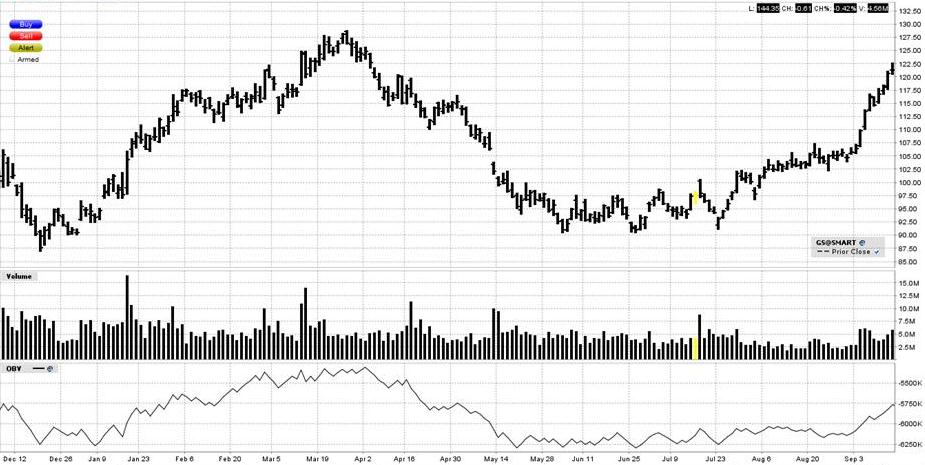
On Balance Volume can also be used as a confirmation of the trend. Observe how the OBV line tracks the price trend in the next chart of Goldman Sachs. The OBV is positive as price rises from December to March but turns negative along with the decline from March to May. Note that the absolute value of OBV is not as relevant as whether the line is rising or falling which indicates positive or negative sentiment. Determine whether the behaviour of OBV confirms the price action or not.
Online Trading Advice: On Balance Volume
OBV is also useful during periods when the market is in a trading range. All traders want to know whether prices will break out to the upside or downside because this can often be the beginning of a big move. If the OBV line is rising even though the market is trading sideways, it can indicate buying interest and accumulation of shares which will ultimately lead to a breakout to the upside. Prices in the chart of Delta Airlines below traded in a range from April to mid-September. However, the OBV line was rising during this period indicating that there was more buying than selling. When the breakout did occur it was to the upside.
Online Trading Advice: On Balance Volume
As with all technical analysis indicators none of them work 100 per cent of the time so it is important to confirm a viewpoint with other analysis. OBV can be incorporated into any trading strategy combining chart patterns or other indicators such as Momentum Indicators like RSI or Stochastic. It can be used with Stocks, Exchange Traded Funds, Forex, Commodities, Bonds, Futures, etc. Traders should always implement appropriate risk management and stop loss strategies.
Return to Top of Online Trading Advice: On Balance Volume