stock futures
Triple Tops and Bottoms
Stock Futures - Triple Tops and Bottoms are a common trading strategy used in Futures trading and other markets such as Stocks, Exchange Traded Funds, Forex, Commodities, Bonds, etc
- With a triple bottom the first bottom occurs at the end of a sustained decline or downtrend.
- The market then reverses and rallies. There is no set percentage that it must rally but with a little experience in observing triple bottoms you’ll get to know what they look like. On a chart it will look like a significant reversal.
- Following the rally the market meets resistance and begins another decline only to find support at the first bottom and rally again. At this stage some traders will interpret this as a double bottom and may enter long postions.
- However, instead of convincingly breaking through the intermediate top the market may undershoot, slightly overshoot or reach that top and commence another decline.
- The market declines again to retest the first two bottoms. If it finds support at these levels again and rallies it has the potential to be a triple bottom. Traders would like to see volume increase with this rally because it shows that the buyers have conviction. As with double bottoms, many traders allow a price fluctuation of approximately 3% of the previous support levels rather than expecting the market to turn at the exact price. Bear in mind that markets can become quite volatile at these levels as buyers and sellers battle it out.
- Buyers setting a price target typically calculate the range from the highest intermediate high to the low and add this onto the intermediate high.
As a practical example, in the daily candlestick chart below, the Nasdaq 100 reached 2035 on 9th August 2011 before commencing a rally to 2213 on 17th August before retracing again to 2034 on 19th August. A double bottom had now formed and the market rallied to make a new high at 2333 on 20th September. Once again the market lost its gains and declined to make a third bottom at 2037 on 4th October.
A trader could calculate the range from the 2333 high to the 2037 low (296) points and add it to the 2333 high to give a price target of 2629. The market made an impressive rally from the third low to reach 2629 on 28th February 2012 and indeed advance further.
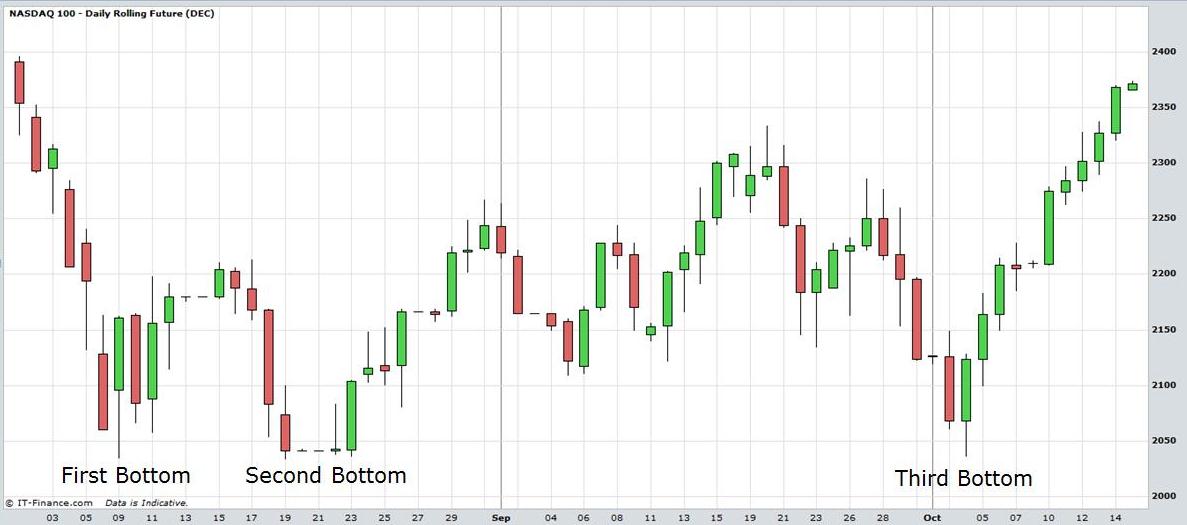
Stock Futures: Triple Bottom. View charts in interactive mode on ProRealTime.com.
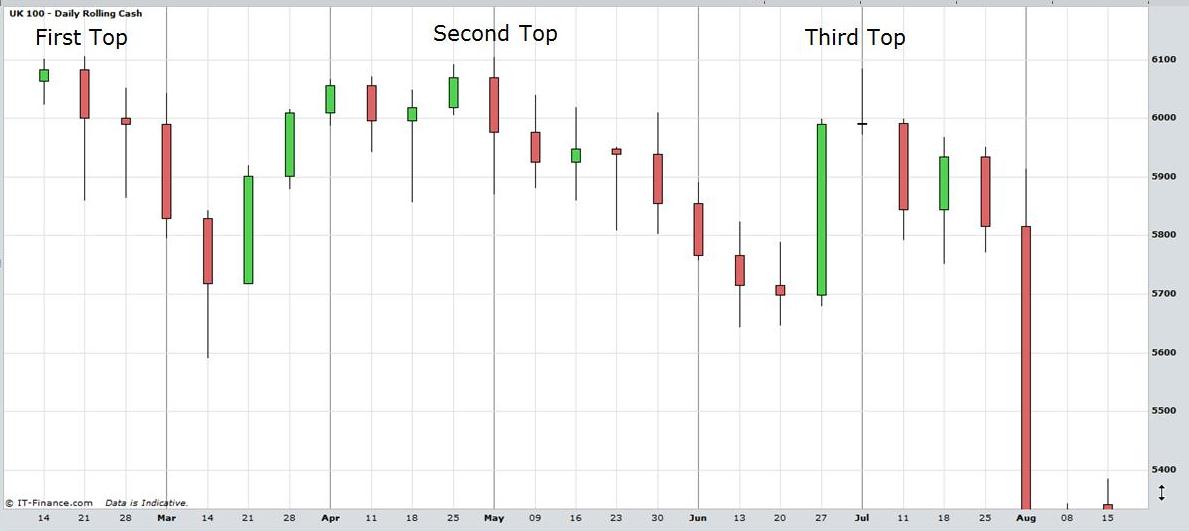
In the next chart, a weekly candlestick of the FTSE100 Index, the market reached 6106 on 21st February 2011
after an eight month advance. After a decline to 5592 the market rallied to
6104 on 15th March. Following a decline to 5644 on 16th June the market
advanced once again to re-test the previous highs. The FTSE100 met with resistance at 6084, just 20 points from the
previous top before commencing a dramatic decline in August. The market
actually reached a price of 4791 on 8th August 2011. A short trade of this
triple top would have produced quick and impressive profits. Of course, any trading strategy should implement appropriate risk management and stop loss strategies.
Return to Top of Stock Futures: Triple Tops and Bottoms
Return to Technical Analysis Charts