Day Trading Training
Candlestick Charts Part 3
Day TradingTraining: Candlesticks can be used in day trading or longer time frames. Candlesticks Part 1 and Part 2 introduced candlesticks, the individual types and how they are interpreted. This section covers formations that involve two candlesticks. They are not stand-alone indicators and should be used in context with other chart patterns or technical analysis indicators as explained in Part 2.
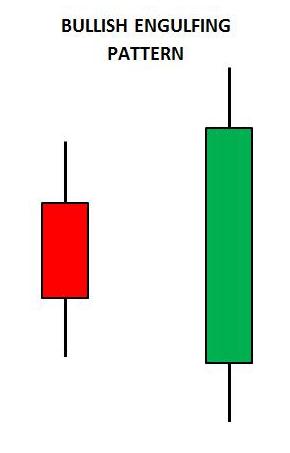
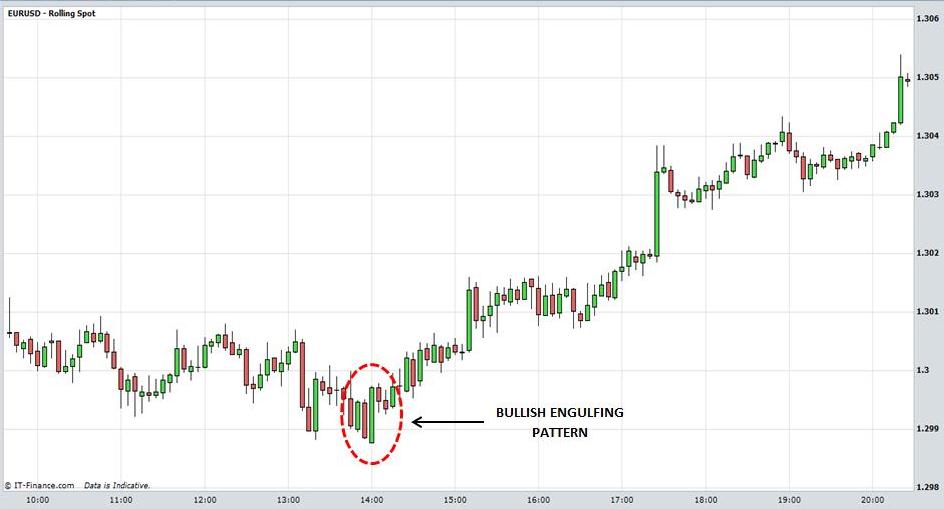
The first is the bullish engulfing pattern which indicates a possible rally in prices. This signal forms when a ‘bearish’ red candle is followed by a ‘bullish’ green candle that engulfs the red candle. To engulf means that the green candle entirely covers the red candle. The body of the green candle should also cover the body of the red candle. It is an even stronger signal if the body of the green candle covers the entire range of the red candle.
It is a bullish signal because the market closed weak on the first day and but a strong rally the second day that overshadows the previous day. This is a sign of strong buying pressure and at least a short term change in market sentiment. It may occur at a potential bottom or strong support level. However, more confirmation to the upside may be necessary before entering a long position.
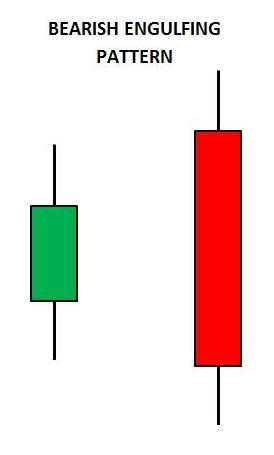
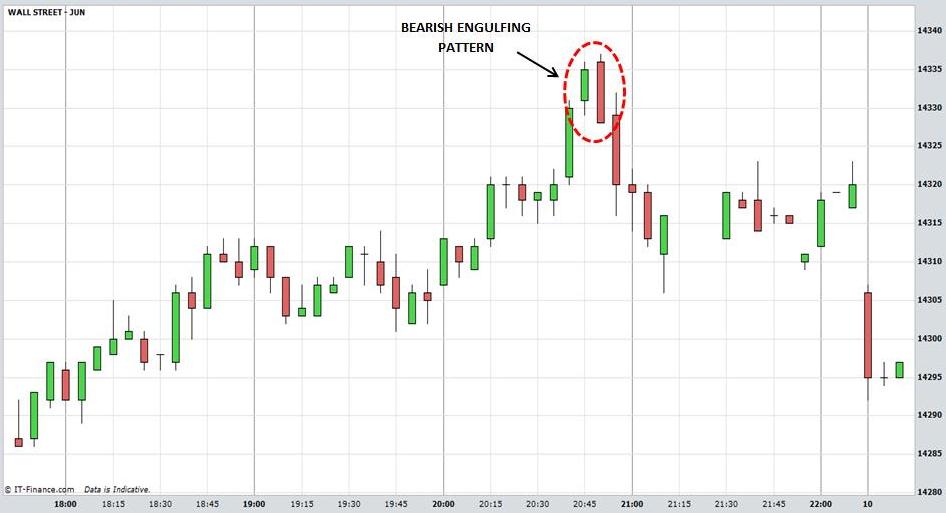
A bearish engulfing formation indicates a possible decline in prices. It forms when a ‘bullish’ green candle is followed by a ‘bearish’ red candle that engulfs the green candle. It may occur at a potential top or strong resistance level. Once again, the red candle should entirely cover the green candle and the body of the red candle should cover the green candle’s body.
Day TradingTraining: Candlesticks
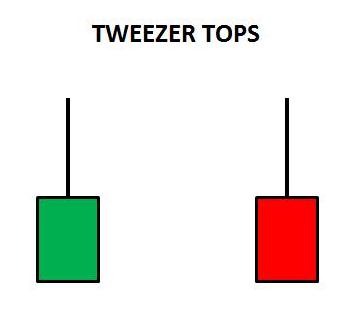
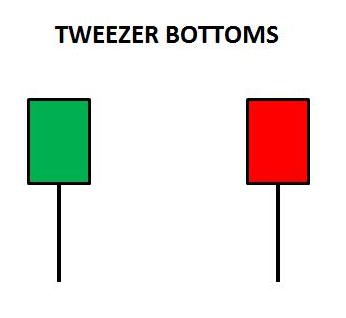
Tweezer tops can occur at the top of an extended rally in the market. Tweezer bottoms can appear at the end of a sustained decline. Each indicates a loss of momentum and a possible reversal in prices.
Tweezer tops should have the same highs or the body should have the same highs. The first candle should be green, in sympathy with the main trend and the second candle should be red. Tweezer bottoms should have the same lows or the body should have the same lows. The first candle should be red, in sympathy with the main trend and the second candle should be green.
Candlesticks are useful in interpreting price action, are not stand alone indicators. They should be used in combination with chart patterns or other technical analysis indicators. Only then will you have a context with which to interpret them.
Return to Top of Day Trading Training: Candlesticks Part 3
Return to Candlestick Charts Part 2
Return to Candlestick Charts Part 1