Best Trading System
Chaikin Money Flow
BestTrading System: Chaikin Money Flow (CMF) was developed by Marc Chaikin and is often used in as a confirmation indicator. Chaikin noticed that when a security was trending it was usually in accumulation (buying) or distribution (selling) but there was no indicator to show this on charts of security prices.
CMF is an oscillator that combines volume and price movement. At its most basic, when a security closes near the high of the trading period and this move is accompanied by higher volume, it is a bullish signal. If the close is near the low of the day with higher volume it is a bearish signal. This helps determine whether buyers or sellers are “in control” of the market.
To understand Chaikin Money Flow it helps to understand the Accumulation/Distribution Line (ADL) which was also developed by Chaikin. Like the CMF, this line indicates whether there are more buyers than sellers during any given time period. It measures the flow of money into and out of a financial security. Although, a little complicated, both ADL and CMF are automatically calculated by most charting software.
ADL for a daily time period is calculated using the following process:
Step 1: Money Flow Multiplier = [(Close – Low) – (High – Close)] ÷ (High-Low)
Step 2: Money Flow Volume = Multiply the result by the daily volume
[(Close – Low) – (High – Close)] ÷ (High-Low) * Daily Volume.
Step 3: ADL = Previous ADL + Current Period's Money Flow Volume.
The Chaikin Money Flow uses Steps 1 and 2 but works similar to a moving average in that it takes the sum of X number of days (usually 21) and divides this result by the total volume for that period.
Think of it as a sign of pressure. A move above the 0 line indicates buying pressure. A move below the 0 line indicates selling pressure. A reading above +0.25 indicates a strong uptrend and below -0.25, a strong downtrend.
It is not a trend indicator but can help identify whether there is conviction in the price movement. Large financial institutions are the real movers of the market. If institutional buyers begin buying or selling a financial security it should show up as increased volume. Chaikin Money Flow also frequently provides early warning of a reverse of the trend. In an uptrend, for example, prices may continue to rise but a decrease in volume may indicate an exhaustion of buying pressure.
Be careful when interpreting the CMF when prices gap as it does not account for them. The Money Flow Multiplier in CMF uses the level of the close relative to the high-low range for the chosen period (daily, weekly, monthly). Normally a closing price near the low of the day indicates weakness. However, the market may have gapped higher on the day’s open and traded down for the rest of the day, yet still close higher than the previous days close. A gap up is a sign of strong buying pressure. A gap down is a strong sign of selling pressure.
Observe the daily bar chart of McDonalds below. Note how the CMF line tracks the trend of the market. Prices decline in line with selling pressure indicated on the CMF. Prices rise in line with buying pressure.
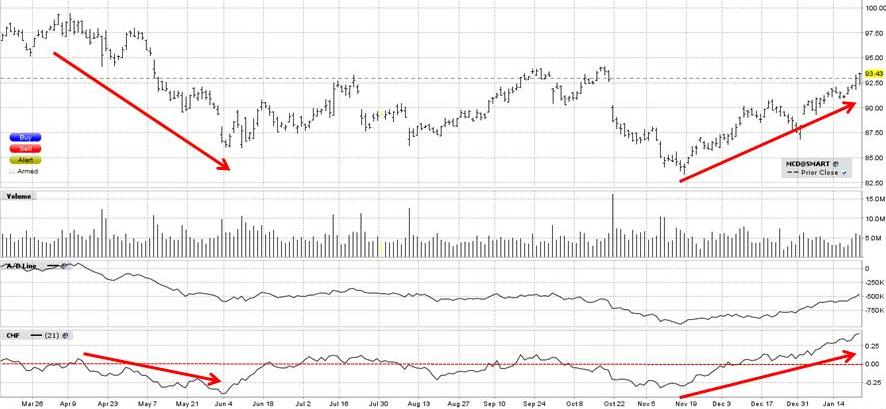
Bes BestTrading System: Chaikin Money Flow.
The next chart of Apple demonstrates how CMF crosses of the 0 line often coincide with changes in price direction. Prices began to range trade in December and the CMF oscillated slightly above and below the 0 line without moving significantly in either direction. Drifting for a time above and below the zero line side (below or above 0.10) is probably not strong enough to declare a bull or bear move.
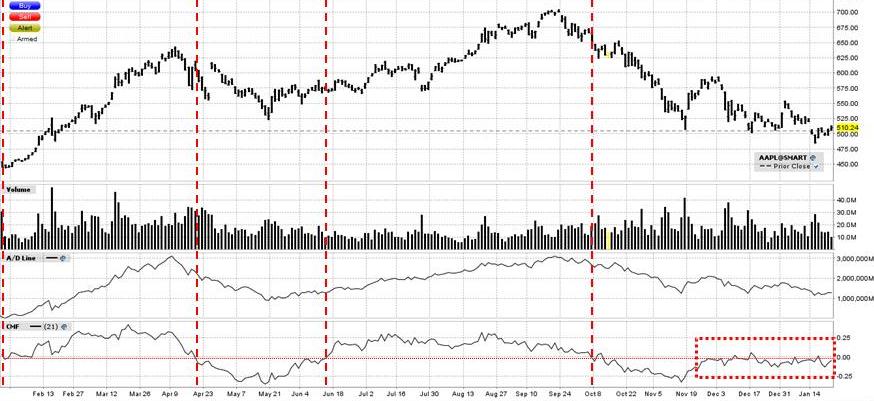
BestTrading System: Chaikin Money Flow
Bullish and Bearish Divergences between Chaikin Money Flow and price movements are also used to trade markets. A bullish divergence is demonstrated in the next chart of Delta Airlines. Prices form a bottom in July, advance to new highs and decline again to form a lower bottom. However, the decline to new lows is not accompanied by a similar decline in CMF. This indicates that there is a lack of conviction in the decline and to prepare for a possible advance. On this occasion the market did rally.
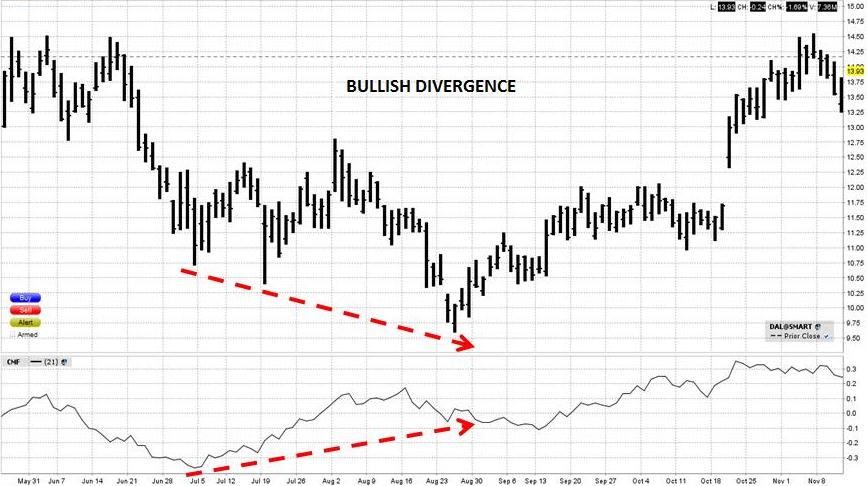
BestTrading System: Chaikin Money Flow
Bearish divergence is a similar phenomenon that occurs at the top of the market. Examine the next chart of General Electric. Prices form a top in October, decline to new lows, then rally strongly to form a higher top in February. However, the CMF does not confirm conviction in the move as it does not rise along with price. Traders may interpret this as a sign that the market is about to decline because of the lack of buying pressure to support the price movement. Eventually, the market did make a significant decline.
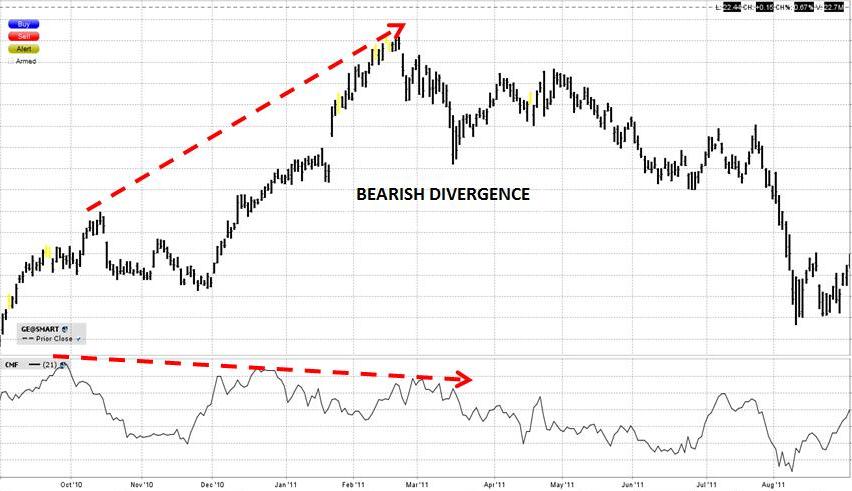
BestTrading System: Chaikin Money Flow
It is best to use CMF as a confirmation indicator along with other technical analysis indicators such as Momentum Indicators and Chart Patterns. It can be used in trading Stocks, Exchange Traded Funds, Forex, Commodities, Bonds, Futures, etc. Traders should always implement appropriate risk management and stop loss strategies.
Return to Top of BestTrading System: Chaikin Money Flow