Futures Trading System
Keltner Channels
Futures Trading System – Keltner Channels were developed by W. Chester Keltner and published in his book, How to Make Money in Commodities in 1960. It is a volatility based indicator and like Bollinger Bands, is composed of three lines. The centre line is based on a moving average that is enveloped by an upper and lower band.
With Bollinger Bands these bands are based on the standard deviation of the financial instrument in question. Keltner Channels, however, use the Average True Range (ATR) which is also a measure of volatility. The distance from the lowest price to the highest price of the day is known as the daily price range and is used in calculating the ATR. The more volatile a market is the higher the ATR because the daily ranges are greater.
Keltner Channels often use an exponential moving average (EMA) which gives a greater weighting towards more recent time periods. Traders can choose their own settings but often it is a 20 day EMA with an ATR set at 2 (double the ATR).
For a 20 day Keltner Channel the calculations are as follows:
- Centre Line = 20 day Exponential Moving Average (EMA)
- Upper Line = 20 day EMA + (10 period ATR X 2). The ATR is calculated over 10 days and this figure is doubled. Adding this to the 20 day EMA gives us an upper price range, the upper band.
- Lower Line = 20 day EMA – (10 period ATR x 2). To get the lower line we subtract from the 20 day EMA.
Interpretation of the Keltner Channel will depend on the market conditions. Prices are obviously stronger at the upper band and weaker at the lower band. However, traders may use these as different entry signals depending on whether the market is in a strong trend or trading in a range.
In a market that is trending upwards, rising prices will create a rising channel. If prices break above the upper band it is a strong bullish signal. Traders may decide to go long. Alternatively, more cautious traders may wait for prices to retrace to the middle or lower line before buying in expectation that the upward trend will continue.
See the daily bar chart below of the Dow Jones Industrial Average from June 2012. The market is in a strong uptrend from June to October. Note how often the market retraced to the lower band after reaching the upper band. One trading strategy is to buy when the market hits the lower band and implement a trailing stop loss as the market continues to rise. The exit would depend on the type of trailing stop loss strategy employed. The area highlighted in red is the first time the market sustains a break below the lower band indicating a downturn which did emerge.
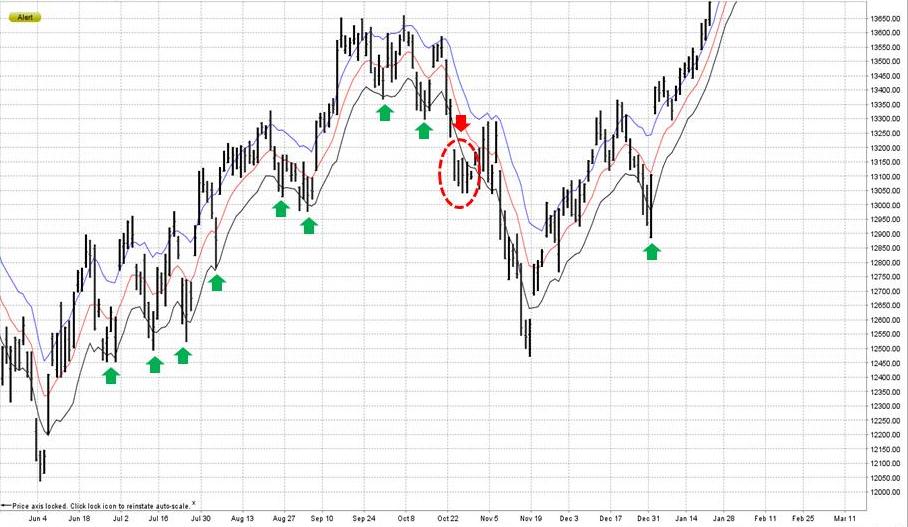
Futures Trading System: Keltner Channels
Typically traders will complement signals generated by the Keltner Channel with other technical analysis such as momentum indicators and chart patterns. The next chart shows a downward trend in the stock price of Apple and combines Keltner with the Stochastic Oscillator. In this case a more profitable strategy would have been to go short when the market rallied to the centre line as it only reached the upper band twice. It all depends on how much risk a trader is willing to take. When the stochastic moves above 80 it can indicate that the market is overbought. If the overall market is in a downward trend then an overbought signal is a signal to enter in the direction of the trend and sell. If this is accompanied by a price movement to the upper band of the Keltner Channel it is added confirmation.
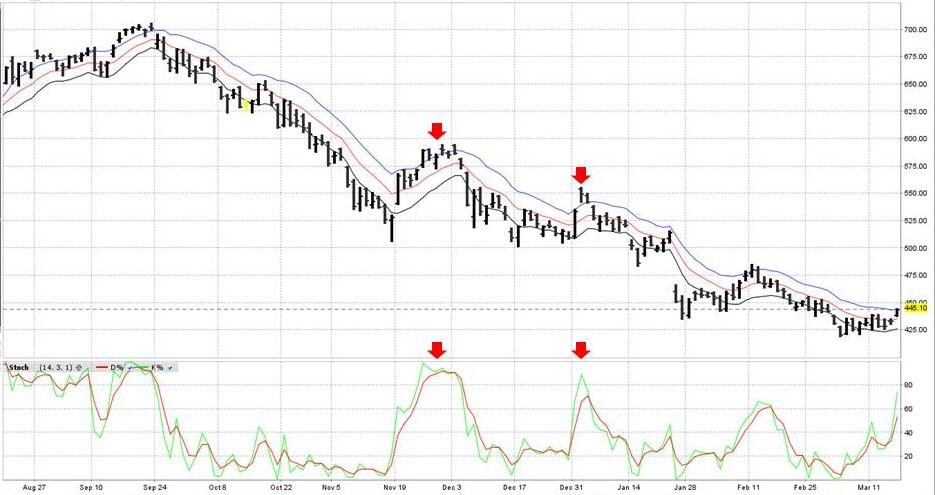
Futures Trading System: Keltner Channels
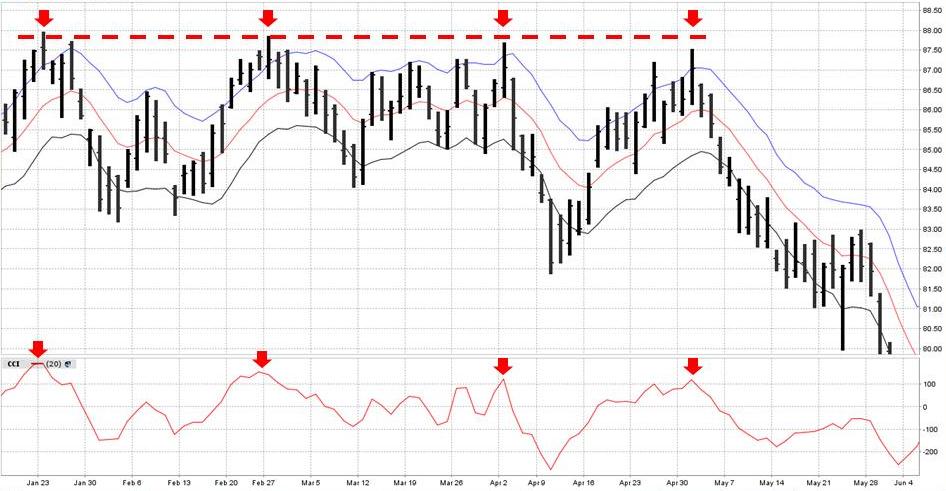
A market that is trading in a range may be interpreted in a different manner. A market in congestion often moves between strong resistance and support levels. Below is a chart of Exxon Mobil. Note how the market met strong resistance between the $87 and $88 level. Traders would be on the alert to sell when the market reached that level because prices had already found it difficult to break above it. Each time the market reached the resistance level it was accompanied by a breakout of the upper band of the Keltner channel. This was also accompanied by a move of the Commodity Channel Index momentum indicator, over the 100 level. It is a signal that the market may be overbought. This is an example of how a number of analysis techniques are used to build a trading strategy. It combines the resistance level, keltner channel and commodity channel index to highlight a selling opportunity.
Futures Trading System: Keltner Channels
Futures Trading System: Keltner Channels
In conclusion, the Keltner Channel can be used on Stocks, Exchange Traded Funds, Forex, Commodities, Bonds, Futures, etc.. It is best to use it in combination with a couple of other technical analysis indicators such as a momentum indicator and align it with relevant chart patterns.
Return to Top of Futures Trading System: Keltner Channels
Return to Volatility Indicators