Stock Trading Systems
Price Envelopes
Stock Trading Systems: Price Envelopes are comprised of an upper and lower band based around a moving average. The bands are fixed at a set percentage away from the moving average which may be simple or exponential. A Price Envelope is similar to Bollinger Bands or Keltner Channels. However, the upper and lower bands of those indicators adjust automatically to volatility in the market. The bands on the price envelope are fixed and the percentage is chosen by the trader in the indicator settings. For this reason, price envelope has been grouped with the trend indicators rather than the volatility based indicators. Volatility, however, plays an important role because the more volatile a market the larger the percentage setting required.
Interpretation of price movement within the envelope will depend on the conditions of the market i.e. whether it is in a strong trend or in range. Because moving averages are an average, prices tend to revert to this mean. Therefore, when prices stretch to the upper or lower band traders may expect a potential reversal. The upper line could be considered overbought and the lower line as oversold. However a market that is strongly trending can remain in overbought or oversold conditions for extended periods of time. For example, in a market that is trending upwards, rising prices will create a rising channel. If prices break above the upper band it could be considered a strong bullish signal. Traders may decide to go long. Alternatively, more cautious traders may wait for prices to retrace to the moving average (the centre line) or lower line before buying in expectation that the upward trend will continue.
Traders also need to experiment with the percentage setting in order that it is relevant to the price action of the market under analysis. A setting that creates an envelope within which prices tend to fluctuate will be helpful in developing a trading strategy. One that is too large or too small will not be relevant because prices will not react at the upper and lower bands.
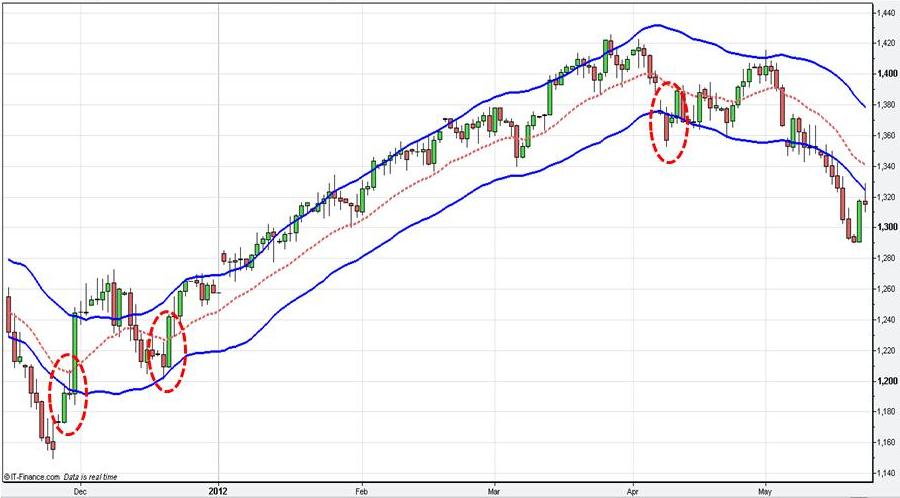
See the daily candlestick chart of the S&P500 index below. Prices made a significant bottom in November 2011. The areas highlighted in red are typical areas where traders might take a long position. Of course at the time no one knows that the market is going to rally until April. However, a trend trader who managed to get long at these low levels could implement a trailing stop loss strategy based on a price envelope. The trailing stop could be set at the lower band or just below it. The envelope settings on this chart are a 21 day simple moving average and a 2% setting. The upper and lower bands, therefore, will track parallel to the moving average at a distance of 2% from it. Traders may also add to their positions on retracements to the moving average. This strategy would have reaped significant profits as it would have kept the trader in the market until prices broke below the lower band in April (highlighted in red).
The question is how you decide
on the percentage setting beforehand. Experiment by testing the indicator on
previous rallies in the S&P500. Although there are never any guarantees back-testing
the system will give a good indication as to what setting will be optimal. Many
charting packages available through online brokerages will allow for testing risk management strategies.
View charts in interactive mode at ProRealTime.com. Stock Trading Systems: Price Envelopes
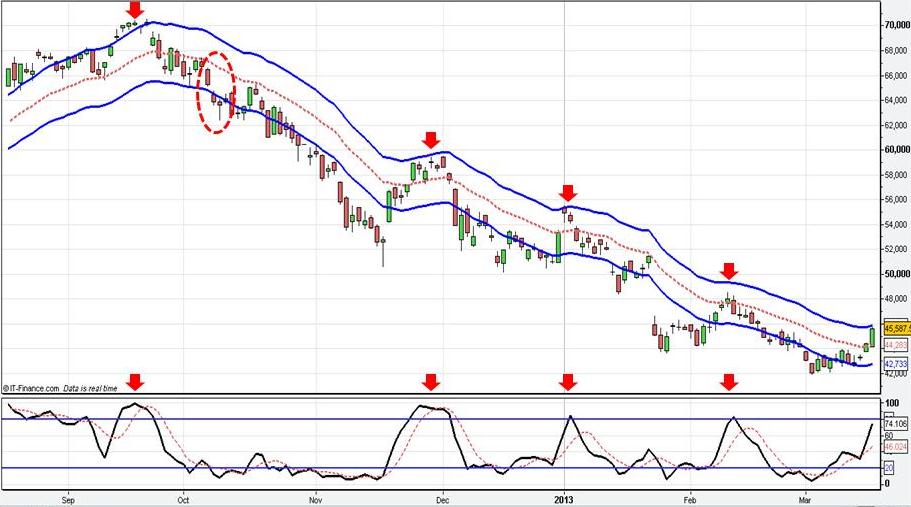
The next chart is of Apple shares which were in a strong downtrend from October 2012 to March 2013. A trader may choose to enter a short trade during the downward swing highlighted in red. The price envelope on this chart is a 21 day exponential moving average with a 2.5% setting. A trailing stop loss order set at the upper band would have seen profits increase for the duration of the downtrend which was still underway in March. Some traders may decide to add to their short positions on rallies to the moving average or upper band.
It is always advisable to combine two or three technical analysis indicators and relevant chart patterns when developing a trading strategy. On the bottom of this chart is a Stochastic Oscillator which is a momentum indicator. When the stochastic crosses the 80 level it can indicate the market is overbought. Note that when the stochastic crossed into the overbought region, Apple shares also reached the upper band of the price envelope. This type of analysis is indicating a number of sell signals. First, Apple is clearly in a downtrend. Second, prices have reached the upper band of the price envelope. Third the stochastic is indicating overbought conditions.
Stock Trading Systems: Price Envelopes
Stock Trading Systems: Price Envelopes
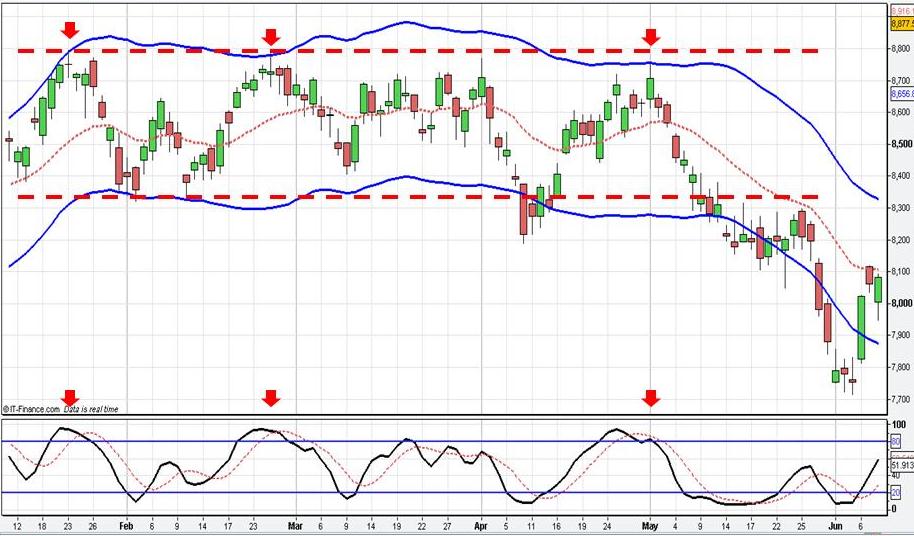
Price envelopes can also be used in a market that is in congestion or trading in a range. Because markets in this condition trade sideways, the moving average will tend to flatten out. The next chart of Exxon Mobil demonstrates how this stock was in a trading range from January 2012 to mid-May 2013. Resistance was met at $88 and support just above $83 forming a trading range between these two levels. The price envelope settings are a 21 day exponential moving average with a setting of 2.8%. To add further confirmation to the analysis, a stochastic has been added.
When prices approach the $88 level traders would be on the alert for a reversal in prices and a potential opportunity to go short. In a range trading market, when prices approach the upper band it signals that prices are overbought. Now combine this with the stochastic that acts as a confirmation because it has also crossed the 80 level into overbought territory. This analysis gives a trader more conviction that a short position is the correct one. The same process can be undertaken to enter a long position at the lower band.
Stock Trading Systems: Price Envelopes
Stock Trading Systems: Price Envelopes
In conclusion, the Price Envelope can be used on Stocks, Exchange Traded Funds, Currency Futures / Forex, Commodities, Bonds, etc. It is best to use it in combination with other technical analysis such as a momentum indicator and align it with relevant chart patterns.
Return to Top of Stock Trading Systems: Price Envelopes