Forum Online Stock Trading
Renko Charts
Forum Online Stock Trading: Renko Charts only measure price movement and omit the elements of time and volume. Developed by the Japanese, each price movement looks like a brick. In fact, the Japanese word for brick is Renga.
Renko charts are similar to Point and Figure Charts. Each brick represents a specific price increment in a financial security. The price increment is selected by the trader. Each time the price advances above the top of the previous brick by the required increment, a white brick is placed in the next column above the previous one. When prices decline below the bottom of the previous brick by the required increment, a black brick is placed in the next column. Some charting packages use different colours for the bricks such as green for rising prices and red for declining prices. New bricks are only added when the pre-determined price movement occurs. Note that the brick only moves by the price increment, even if the price movement was actually a little more. Furthermore, a reversal of the bricks will require a price decline that is double the price increment. In an uptrend, therefore, the market has to move down from the top of the previous brick plus one more price increment below it.
The effect of this is that the Renko chart is less volatile and filters out minor price increments apparent in other charts types. This is particularly useful for traders/investors who wish to stay with their positions in a trend. An appropriate price increment will contribute to a very profitable trading strategy in a trending market. It is important, therefore, to select the best one. Test different price increments on historical data to find a level of sensitivity that will keep you with the trend as long as possible. It is generally agreed that the most profitable trading strategy is to trade with the trend and persevere with it as long as possible.
A basic trading strategy in an upward trend may simply involve putting a stop loss under each rising brick or above each declining brick in a downward trend.
Renko charts can also be used to identify and trade chart patterns such as resistance, support, double tops/bottoms, range trading etc. Click on chart patterns for further information . Often these patterns are easier to identify with the Renko system because of the reduced volatility.
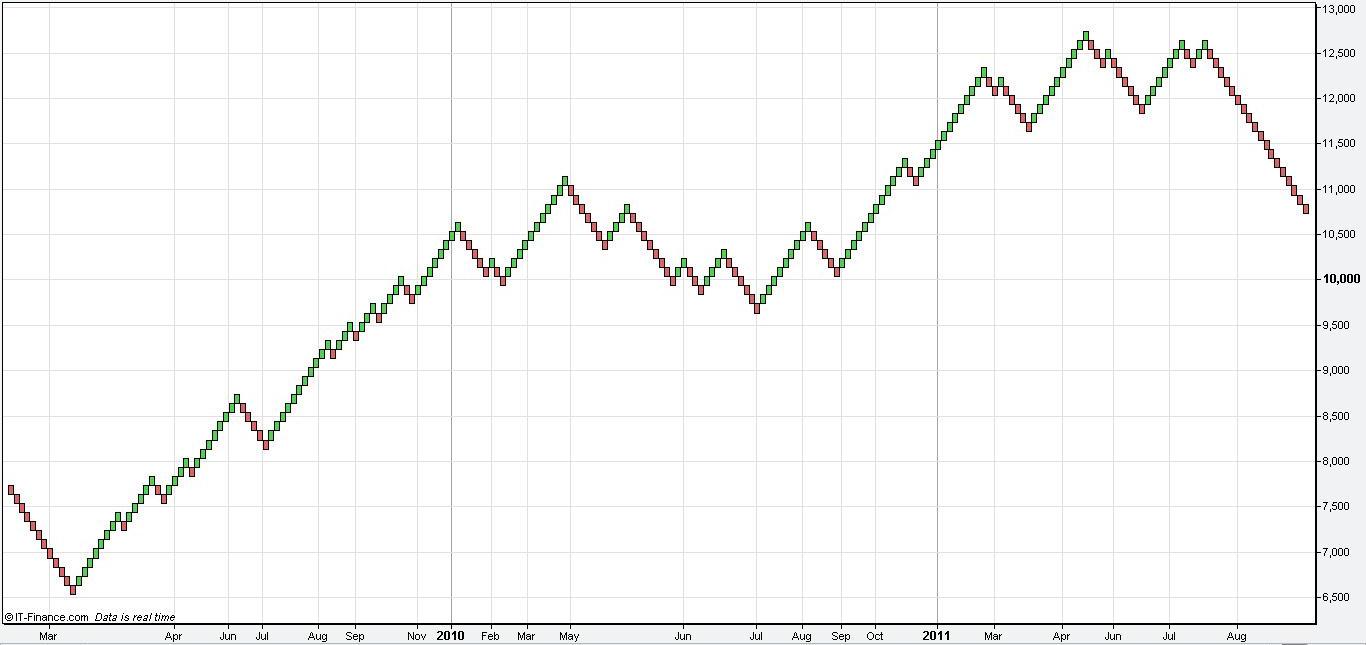
Examine the Daily Bar and Renko charts of the Dow Jones stock index below. The price increment is set to 110 points. This means that a brick is not entered into a column unless the Dow Jones moves by that amount. Observe how the Renko reduces volatility and is less “noisy” than the daily bar chart. During uptrends a trailing stop loss under each brick would have secured significant profits. Alternatively, a trader may place a stop under each swing low and maintained long positions for an even longer period.
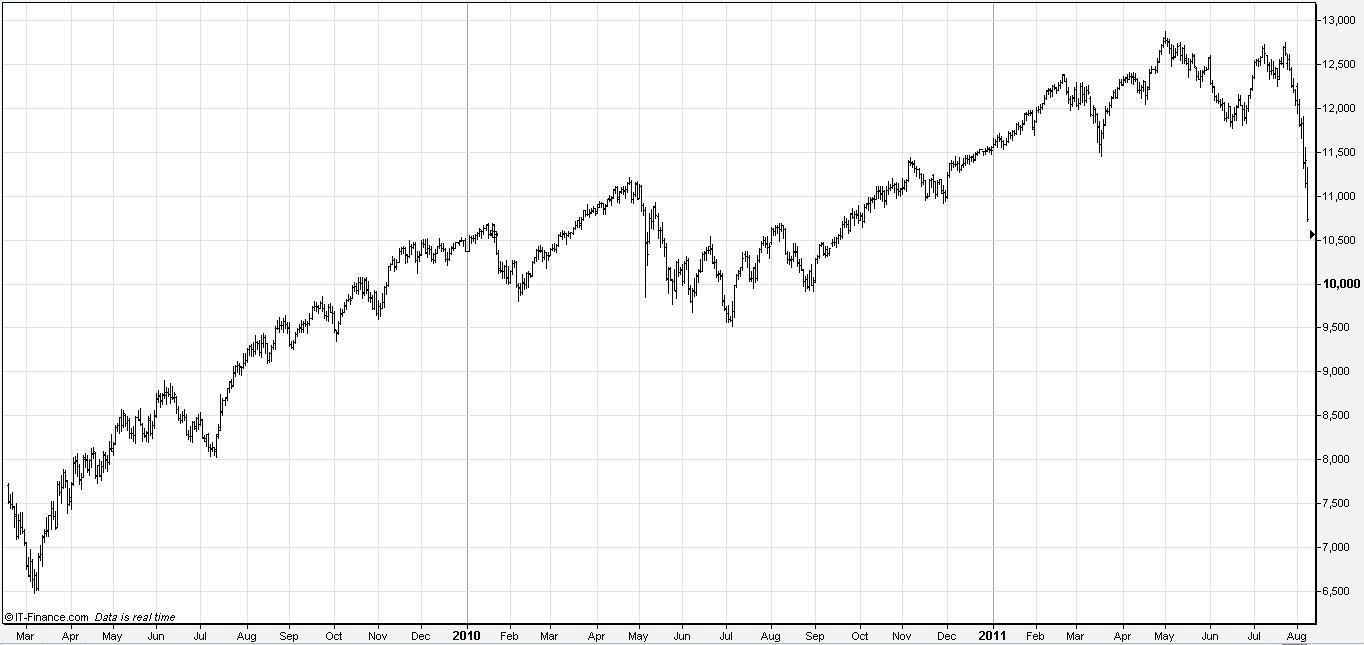
View charts in interactive mode at ProRealTime.com
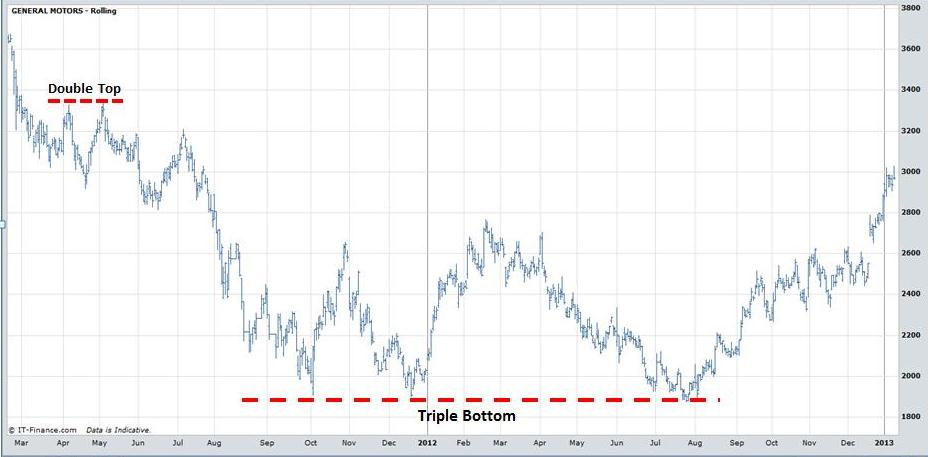
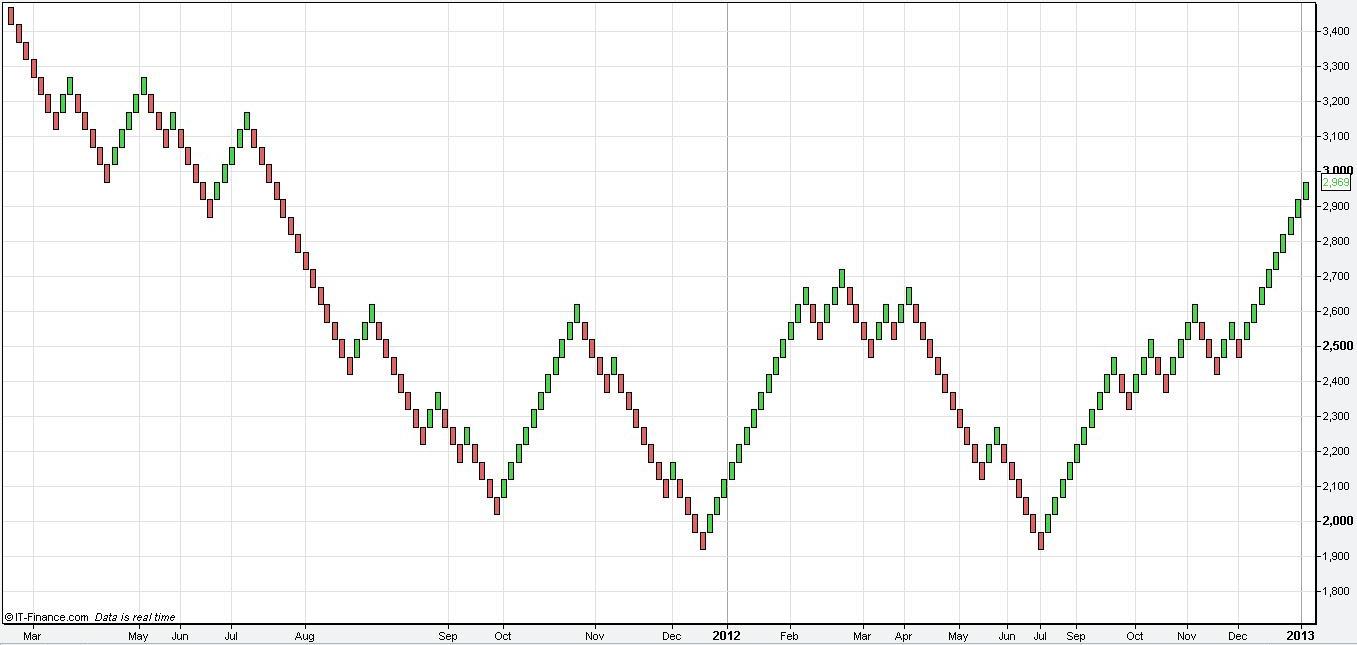
The following charts of General Motors demonstrate how the Renko method identifies popular chart patterns such as double tops and bottoms. The price setting in this case is 50 cents. Once again the chart is much clearer than the daily bar chart as minor swings are reduced.
Forum Online Stock Trading: Renko Charts
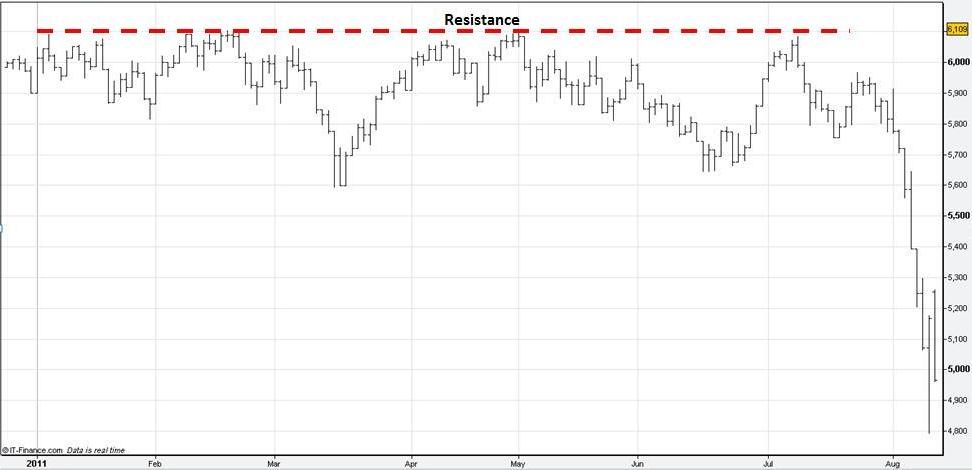
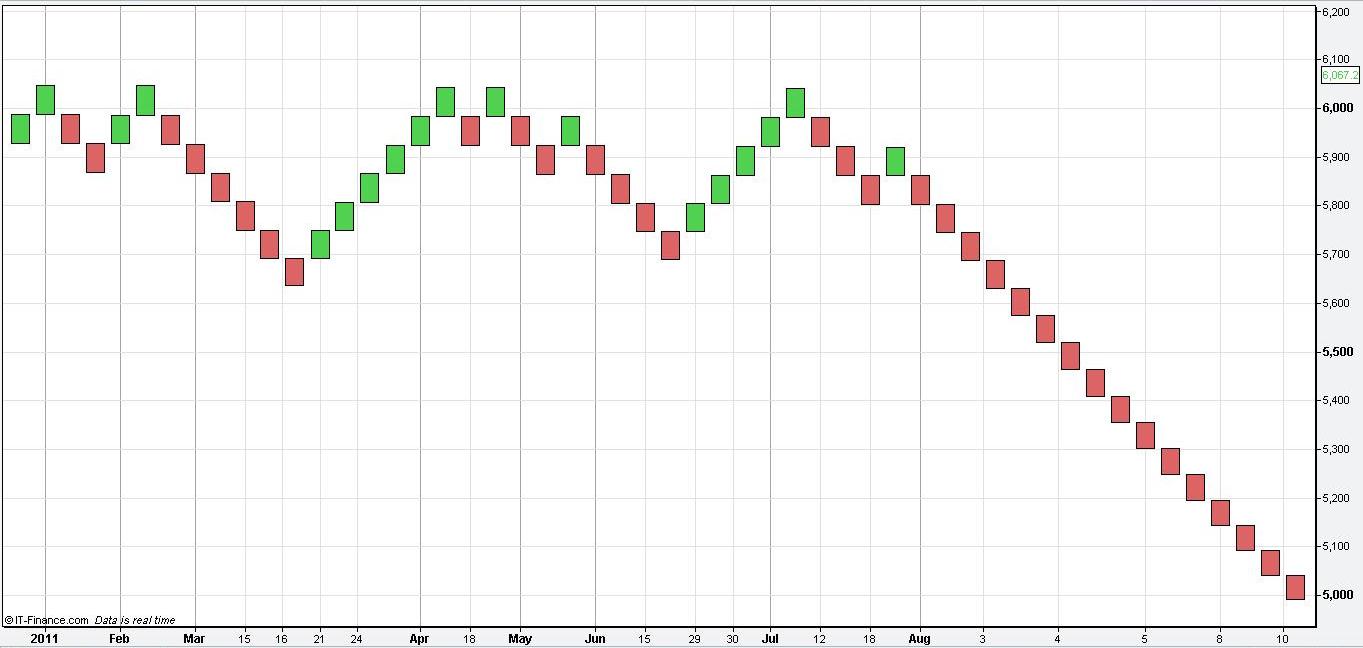
The last example is slightly different in that it uses a percentage price increment rather than points. Most charting packages will provide this feature. The method is the same but in order for a brick to be entered the market must move a set percentage rather than a specific number of points. The Renko chart of the FTSE 100 below is set at a percentage of 1% and demonstrates the concept of resistance as effectively as the bar chart.
Forum Online Stock Trading: Renko Charts
Return to Top of Forum Online Stock Trading: Renko Charts