Futures Trading Charts
Linear Regression Slope
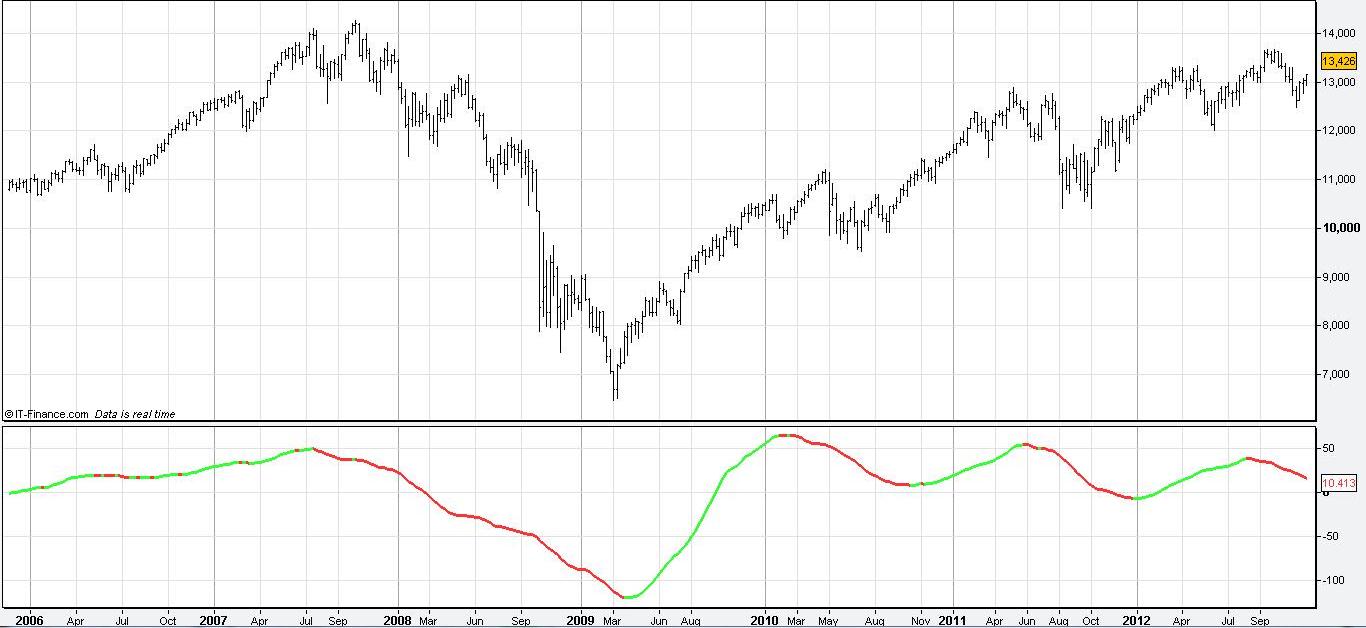
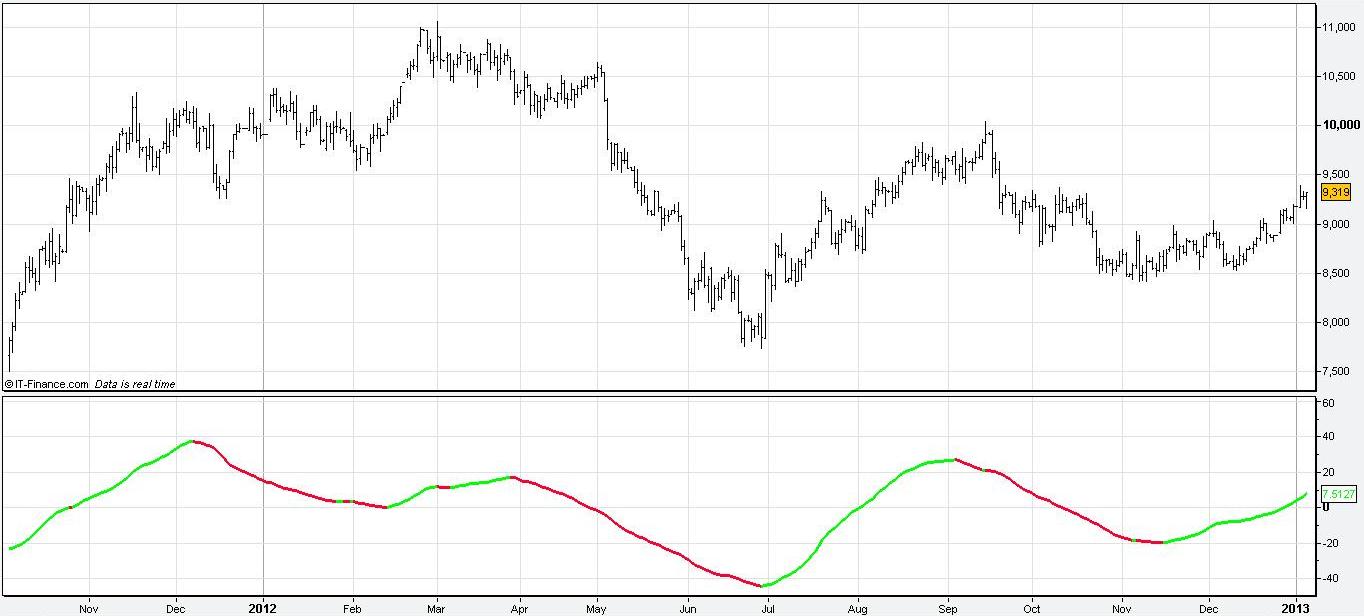
Futures Trading Charts: Linear Regression Slope can be used to trade any financial market including Futures, Forex, Stocks, ETFs, Commodities, Bonds etc. Linear regression is a statistical technique used to identify the strength and direction of a dominant market trend. The calculations are complicated but charting packages perform them automatically. The linear regression slope indicator is plotted as a line that fluctuates above and below a central line drawn at 0. If the indicator rises above the 0 level the market is considered in an upward trend with positive momentum. A decline below 0 indicates a downward trend. The further away the indicator moves from the 0 line the more momentum in the market. A steeper slope signifies a sharper advance or decline.
Unlike other oscillators like the RSI, Stochastic or Williams %R, it is not bounded by upper and lower bands. It is not best suited, therefore, for identifying overbought or oversold market conditions but is designed to measure the direction and strength of the trend. It does not predict the trend however. It is a lagging indicator so is used as a confirmation indicator to verify the trend. It will not anticipate potential tops and bottoms in the market.
Typically, traders use other indicators to identify buying or selling opportunities once the trend has been established. For example, the linear regression slope may indicate an uptrend but a trader/investor may wait for a pullback in prices or for an oscillator to indicate oversold conditions before entering a long position with the trend. Alternatively, investors may decide to sell stock when the indicator turns downwards.
Deciding on the time frame setting for this indicator depends on the period being studied. As a general rule, 10 days applies to a short-term trend, 100 days a medium-term trend and 250 days a long term trend.
Traders/investors also use linear regression slope as a way to compare the performance of securities to each other or to an index. For example, an investor with an interest in a stock can use the indicator to assess whether it is under or over performing the overall market.
Below are daily bar charts of the Dow Jones and Oil. Notice how the indicator slopes upwards (green line) when the trend is up and downwards (red line) when the trend is down. Traders and investors in these markets may use this indicator, therefore, to confirm the bullish or bearish bias of the market and trade accordingly.
Futures Trading Charts: Linear Regression Slope. View charts in interactive mode at ProRealTime.com.
Futures Trading Charts: Linear Regression Slope
Return to Top of Futures Trading Charts: Linear Regression Slope