Head and Shoulders
Technical Analysis Stock Market
Technical analysis stock market: The Head and Shoulders pattern can be used in trading Stocks, Exchange Traded Funds, Forex, Commodities, Bonds, Futures, etc. It is a reversal pattern so a head and shoulders top occurs at the end of an uptrend and a reversal head and shoulders occurs at the end of a downtrend.
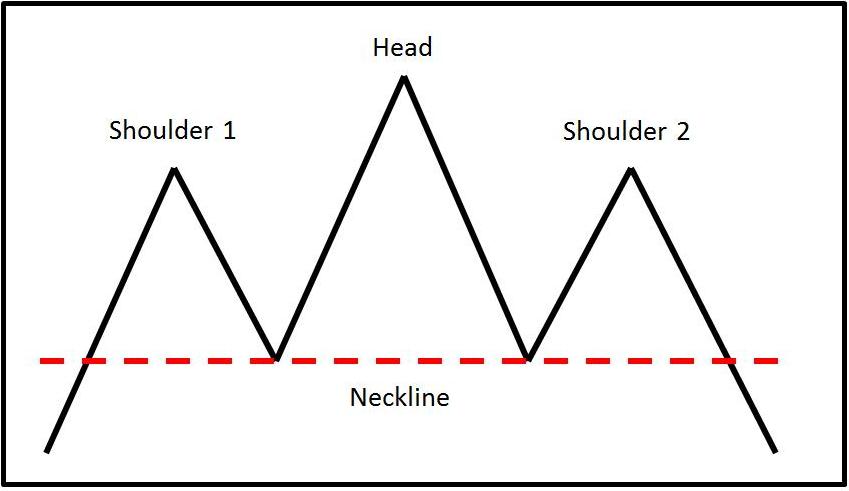
The ideal anatomy of a head and shoulders top and bottom can be seen in the charts below.
- Shoulder 1: The market is trending upwards, meets resistance then declines, forming the first shoulder.
- Head: However, the uptrend is still intact as the market advances again and makes new highs, breaking through the first shoulder top to form a head.
- The market retraces again but makes a steeper decline receiving support around the previous low.
- Shoulder 2: The market rallies again to form a high around the same price as the first shoulder and forms the second shoulder. The market may not turn at the exact price of the first shoulder so allow for this. Traders might apply the 3% rule as used in the examples of double tops/bottoms.
- As the market declines again it declines to the neckline and breaks through this support to further lower prices. Traders estimating a price target for a short position will often take the price range from the head to the neckline and subtract this from the neckline.
The market may not reach
this target but the head and shoulders pattern is a strong indicator of lower
prices ahead. As with all chart patterns, traders should implement appropriate risk management and stop loss strategies in case they are wrong.
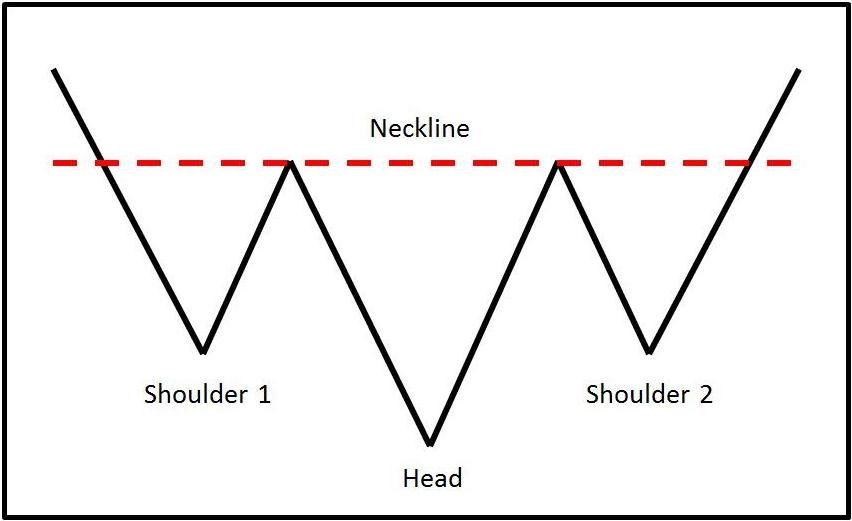
The same process takes place at a head and shoulders reversal bottom. Now traders are looking to buy or exit long positions.
In the real market, it is unlikely that the pattern will look as neat and tidy as the this. The shoulders may not turn on the exact same price or the neckline may not be exactly parallel but the analysis can still be applied.
Technical Analysis Stock Market: Head and Shoulders Pattern
The following daily candlestick chart is an example of a head and shoulders reversal bottom of Gold.
- First Shoulder: The market declines to a price of $571 on 5th Sept 2006.
- Market rallies to $607 on 28th September.
- Head: Trend remains intact and market declines to $559 on 5th October.
- Rally to $602.50 on 20th October. Down trend now under threat as market looks like it could be trading sideways.
- Second Shoulder: Decline to $573 on 24th October
- Downtrend reverses as the rally from the second shoulder breaks the neckline and reaches a price of $649 by 30th November. Following a sharp decline it rallies again to further higher prices.
- Price range from head to neckline: $606 – $559 = $47.
- Price Target:
$605 + $47 = $652.
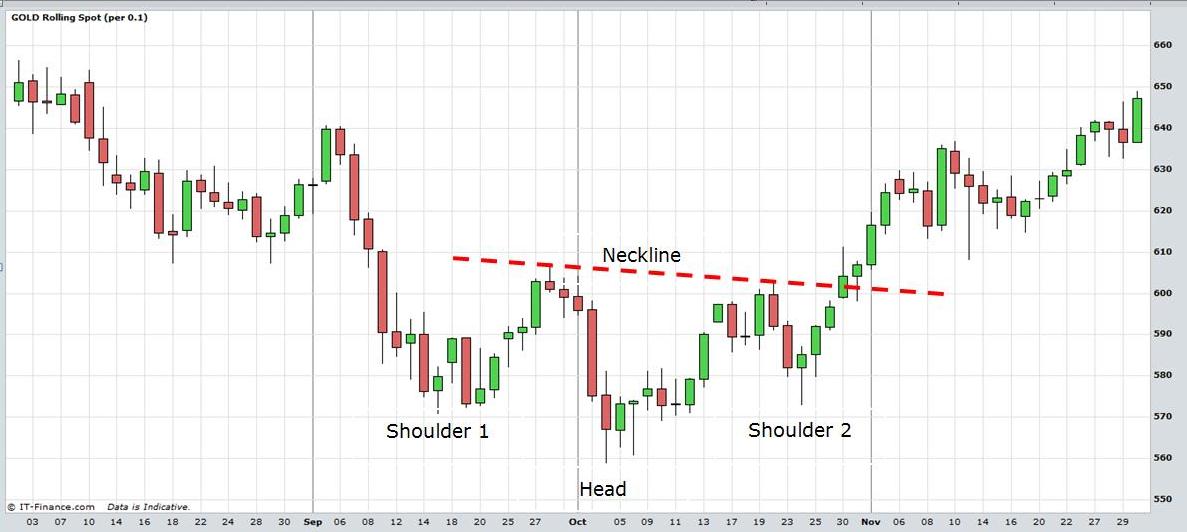
Technical Analysis Stock Market: Head and Shoulders Bottom. View chart in interactive mode at ProRealTime.com.
The next chart, a daily candlestick chart of the GBP/USD currency pair, demonstrates a head and shoulders reversal top pattern.
- First Shoulder: The market rallies to a price of 1.849 on 2nd June 2004.
- Market then declines to 1.8012 on 30th June.
- Head: Uptrend remains intact as market rallies to form head at 1.8775 on 19th July.
- Decline to 1.8085. Uptrend is now under threat as market is looks like it is trading sideways.
- Second Shoulder: Rally to 1.8469 on 6th August.
- Uptrend reverses as the rally from the second shoulder breaks the neckline and declines to a price of 1.771 on 7th September.
- Price range from head to neckline: 1.8775 – 1.8075 = 700 pips.
- Price Target: 1.0875 – 700 pips = 1.7375.
- Market reached 1.7710, on 8th Sepember 2004, a significant decline but it failed to reach the estimated target.
This example is shown to demonstrate that although patterns are widely used and traded beware that they don’t always reach the targets we set them. Targets depend on each individual trader and trades must be monitored.
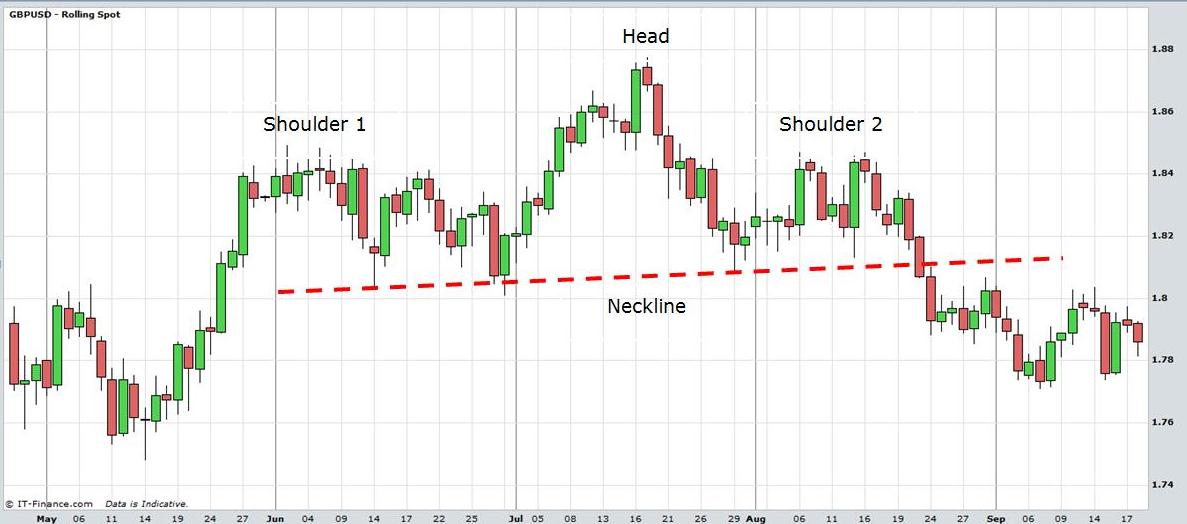
Technical Analysis Stock Market: Head and Shoulders Bottom.
Return to Top of Technical Analysis Stock Market: Head & Shoulders
Return to Technical Analysis Charts