Reversal Bars
Technical Analysis Stocks
Technical Analysis Stocks: Reversal bars are often an indication of a turning point in the market and hold the potential of a top or bottom. The reason for this is that the bar represents a change in trading sentiment.
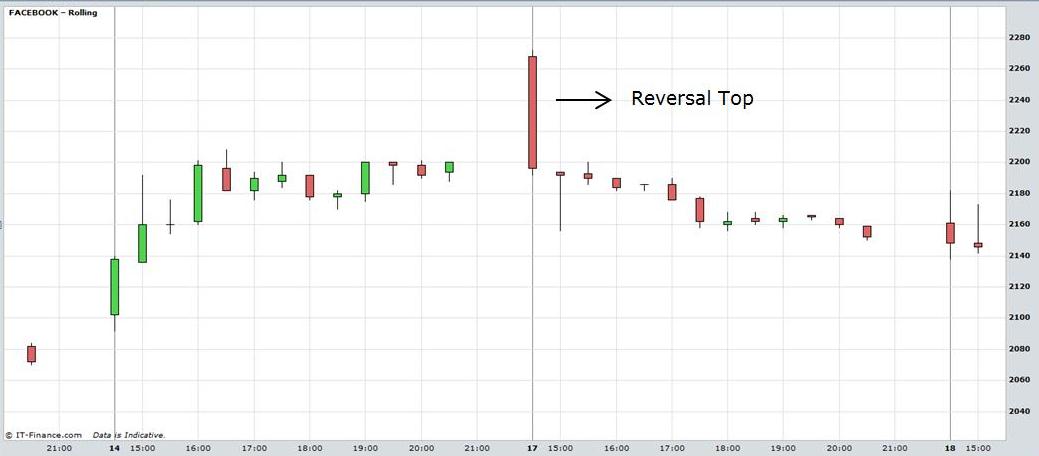
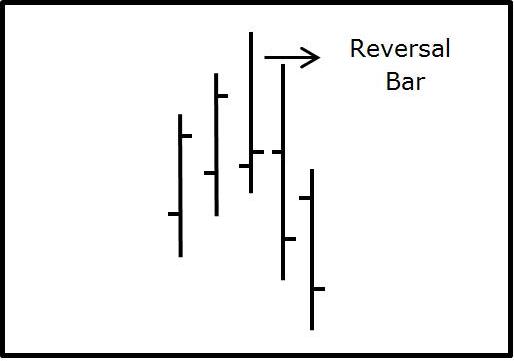
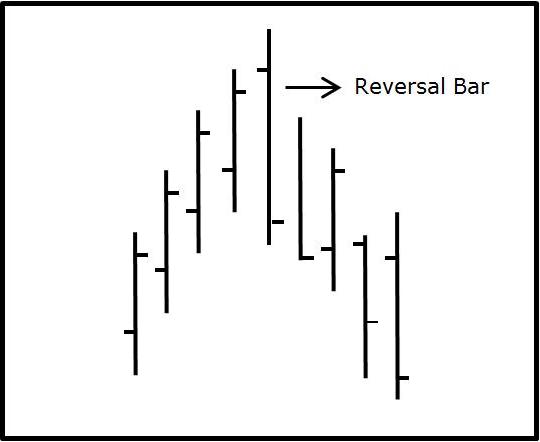
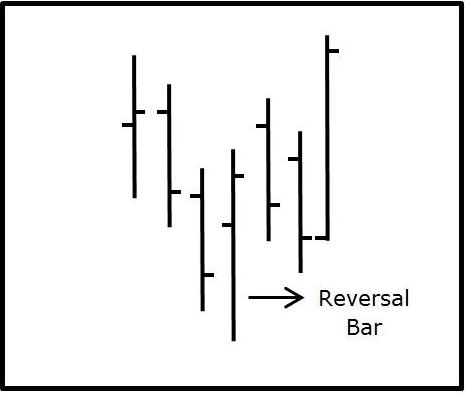
A market top reversal bar occurs after the market has been making a sustained advance. On the day of the reversal, the market makes a new high but closes weak, i.e. at least in the bottom third of the bar. When traders, trading stocks online see this market action they may interpret it as a signal to exit their long positions or take a short position.
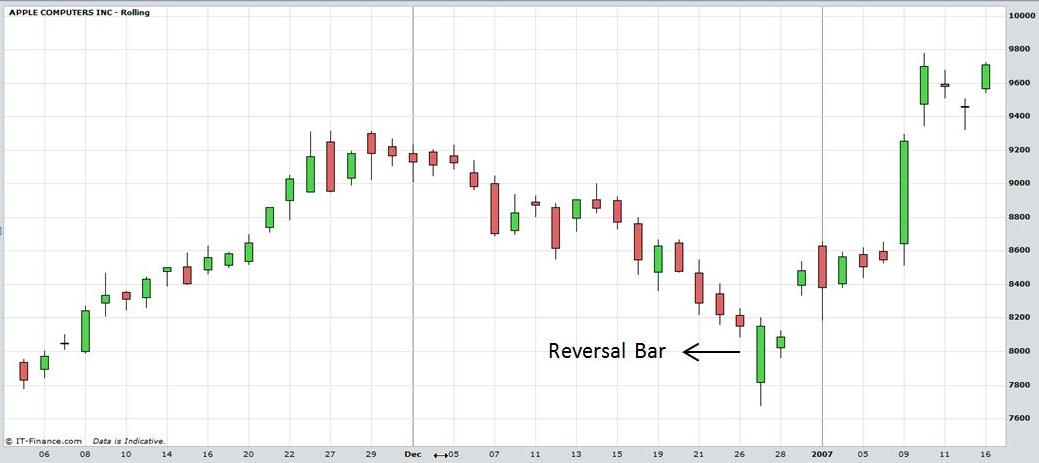
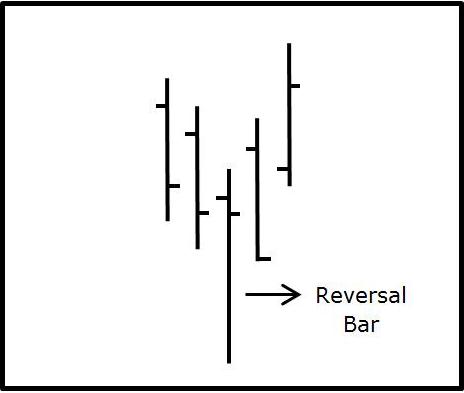
A market bottom reversal bar occurs after the market has declined for a period but on the reversal day, the market makes a new low but closes strong, i.e. at least in the top third of the bar. Traders may use this as a signal to buy.
In either case the traders may wait for further confirmation in the next time period before taking a position in case it proves to be a false signal.
A reversal bar can be useful in any time frame be it intra-day, daily, weekly or monthly. However, the extent of the reversal to be expected should be relevant to the time frame. For example, an intra-day reversal bar on an indicator of a monthly change in trend. It may only prove to be an intraday reversal that will be broken before the day’s trading is over.
A reversal can be interpreted as stronger if it occurs with high volume. In addition, if the range of the bar is bigger than the average range it represents more conviction. It means the market was up or down more than usual and has reversed more than usual. Furthermore, if time and price studies coincide with a reversal bar it gains more significance.
The candlestick charts below show the different types of reversal bars that can occur.
They don’t all look the same but the common characteristics are a new high or
low followed by a reversal to the close. Appropriate risk management and stop loss strategies should be implemented when trading reversal bars.
View Charts in interactive mode at ProRealTime.com.
Return to Top of Technical Analysis Stocks: Reversal Bars
Return to Technical Analysis Charts