Flags and Pennants
Technical Analysis Stock Charts
Technical Analysis Stock Charts: Flags and Pennants that are continuation chart patterns occur in the middle of a trend. They represent a period in the market when there is consolidation before the market continues the previous trend. Often they are preceded by heavy volume as the market has made a significant move up or down and is now taking a breather before the next move. It is usually a short term pattern. When it goes much more beyond a month you could say that the market is just range trading as described on the Rectangles Page.
The chart of AUD/USD below demonstrates a bullish continuation flag pattern.
- The flagpole represents the break through resistance upwards to the top of the move before the flag begins to form. Traders like to see high volume during this move as it signifies conviction.
- The market meets resistance around the 0.7320 level in mid-April 2009.
- It breaks through this resistance on 2nd May to run up sharply to top out on 3rd June at 0.8264. This is the flagpole and the range from low to high is 944 pips. (0.8264 - 0.7320)
- The flag is formed as the market trades in a range (between the parallel lines), sloping against the trend.
- This consolidation lasts until the breakout on 18th July.
- If we add the previous range (the flagpole) to the low on 18th July we get a target of 0.8968 (0.8024 + 944 pips).
- The market reached the target on 8th October.
- Some traders would add the range to the high made on 3rd June
to estimate a target for a long position.
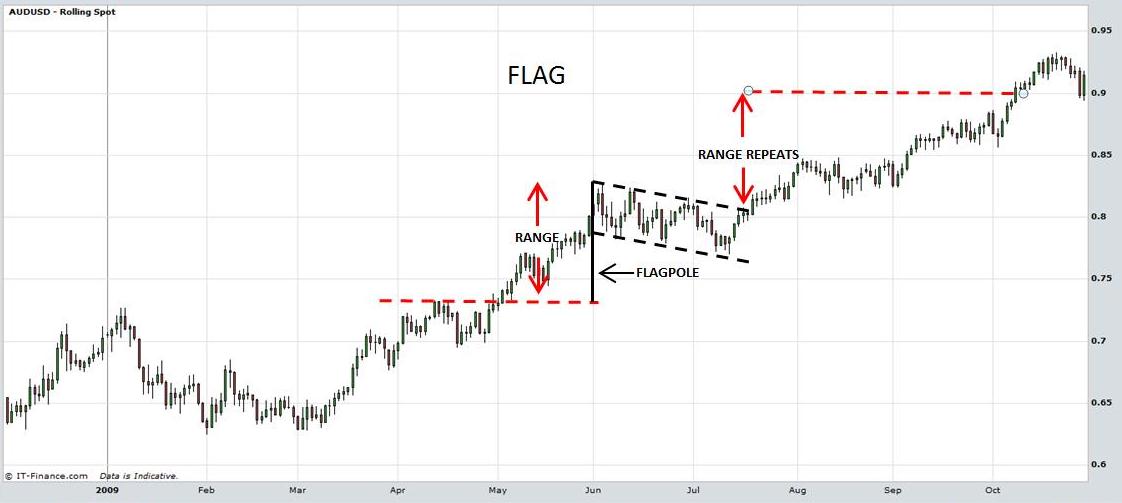
Technical Analysis Stock Charts: Continuation Bullish Flag. View chart in interactive mode at ProRealTime.com
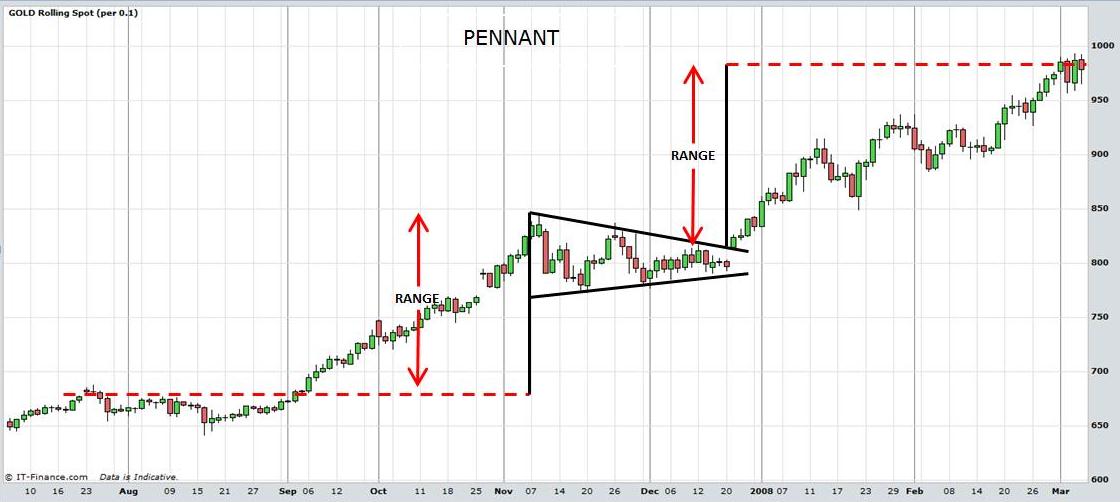
A pennant is similar to the flag but the consolidation period is in the shape of a symmetrical triangle with the price range narrowing as it progresses. This is demonstrated in the Gold chart below.
- Gold breaks through resistance on 6th September 2007.
- The market rallies strongly to top out at 846 on 8th November.
- This advance represents the flagpole.
- The market then declines to make a low at 743 on 20th November.
- Prices enter into a consolidation period forming a pennant shape.
- Finally, the market breaks out of consolidation on 26th December.
- To estimate a target for the market to reach we add the previous range made by the flagpole to the beginning of the breakout. Again, some traders may add it to the high on 8th November.
- The range from the 6th September 2007 low (680.7) to the November 8th high (846) = 165.3
- Add this range to the low on the breakout on 6th September (814.4) = 979.7.
- Gold reached 979.7 on 3rd March 2008.
Technical Analysis Stock Charts: Continuation Bullish Flag
Flags and pennants can manifest in Stocks, Exchange Traded Funds, Forex,
Commodities, Bonds, Futures, etc. Traders should alway adopt effective risk management and stop loss strategies when trading.
Return to top of Technical Analysis Stock Charts: Flags and Pennants
Return to Technical Analysis Charts Page