Rising and Falling Wedges
Technical Stock Market Analysis
Technical Stock Market Analysis: The rising and falling wedges are patterns used to interpret price movement in markets.
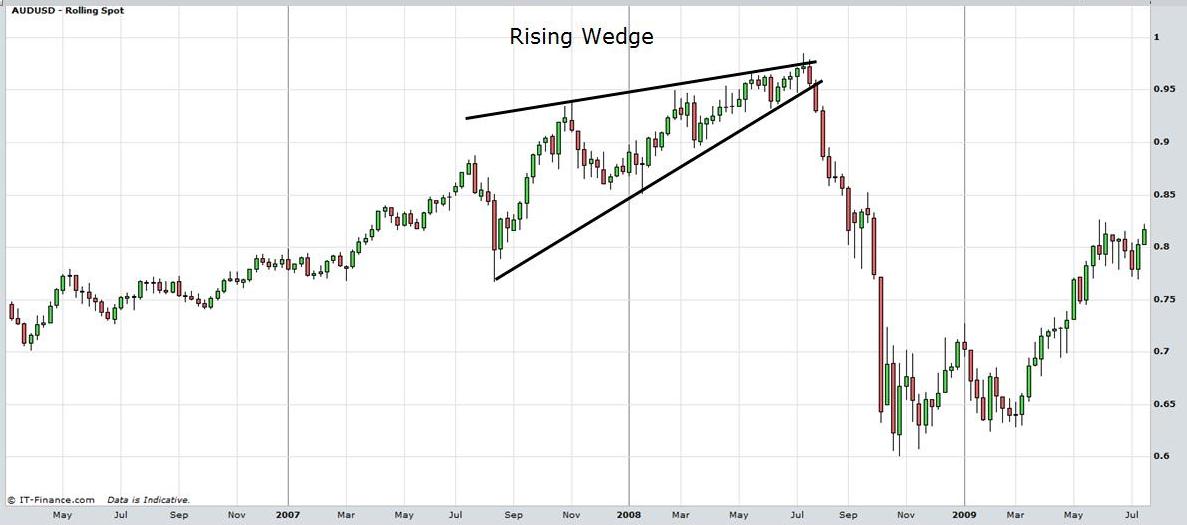
The rising wedge may be a reversal pattern or a continuation pattern but it is always bearish. That means that the rising wedge may occur at the end of an uptrend which makes it a reversal pattern or in the middle of a downtrend which makes it a continuation pattern.
The characteristic of a rising wedge is that the support line rises at a steeper rate than the upper resistance line. This results in a narrowing of the trend channel. See the accompanying weekly candlestick chart of the Aussie Dollar currency pair which shows a rising wedge reversal pattern developing from September 2008 to July 2009.
Although the support line continues to make higher bottoms and the resistance line continues to make higher tops, the upper line is not matching the rate of increase. This may be interpreted as a loss of momentum in the market and a possible decrease in prices.
Typically
the rising wedge takes three to six months to form. It takes two tops to form an upper trend line
and two bottoms to form the lower trend line. However, traders like to see the
market touch the line at least three times. Eventually, as the band narrows the
market breaks through the support line indicating further lower prices. An
increase in volume during the
breakdown is also a good indication that further lower prices lie ahead. Traders should adopt appropriate risk management and stop loss strategies when trading wedges.
View chart in interactive mode on ProRealTime.com.
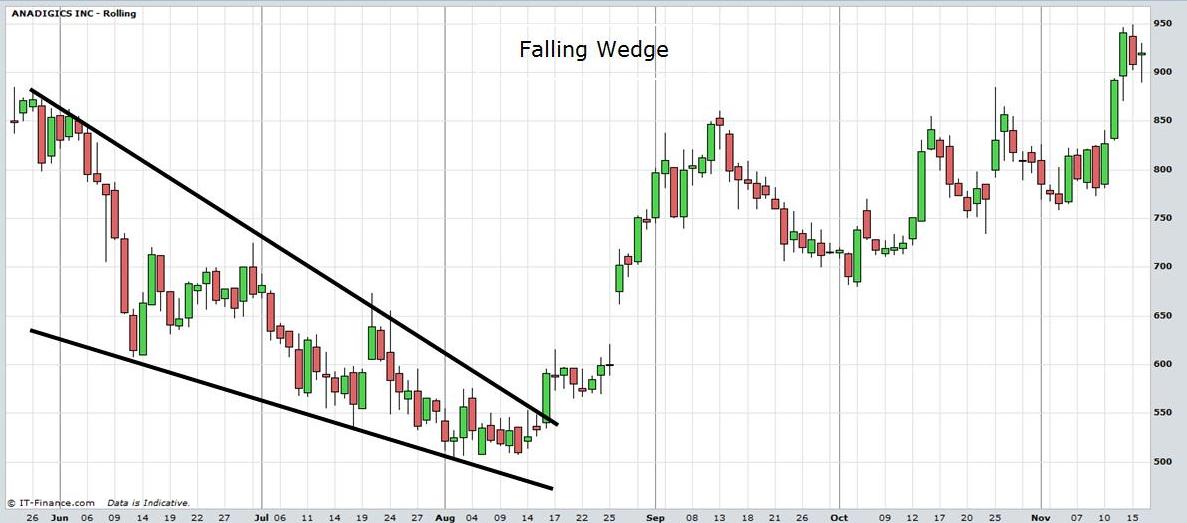
Falling wedges are bullish patterns. It has a wide range at the top which contracts as the pattern progresses. A reversal falling wedge can form at the bottom of a downtrend or as a continuation pattern, in the middle of an uptrend.
See the accompanying daily candlestick chart of Anadigics Incorporated. The market continues to make lower tops and lower bottoms forming resistance and support lines. However, the support line does not decline at as steep a rate as the resistance line. Eventually as the range contracts, the market breaks the resistance line to the upside. Again, traders like to see an increase in volume to show the market has conviction in the rally.
Return to top of Technical Stock Market Analysis: Wedges
Return to Technical Analysis Charts