Trading Commodities Online
Elliott Wave Theory
Trading Commodities Online: Elliott Wave isn’t really classified as an indicator but is a popular method of analysing markets. It can be applied to all financial markets including Stocks, ETFs, Commodities, Forex, Bonds Futures, etc. It was developed by R.N. Elliott in the 1930s who discovered that stock market prices trend and reverse in recognizable patterns. Elliott’s theory was published in his book, The Wave Principle, in 1938 and remains an important forecasting tool for many market analysts. As a description of how markets behave, it provides a road-map for possible future prices. Elliott himself predicted a multi-decade bull market in the 1930’s when the Dow was at 100 and the majority felt the Dow would never reach its 1929 peak. His forecasts were often remarkably precise years in advance. Interestingly, the wave structure produces the Fibonacci sequence of numbers discussed on the page Fibonacci Retracements.
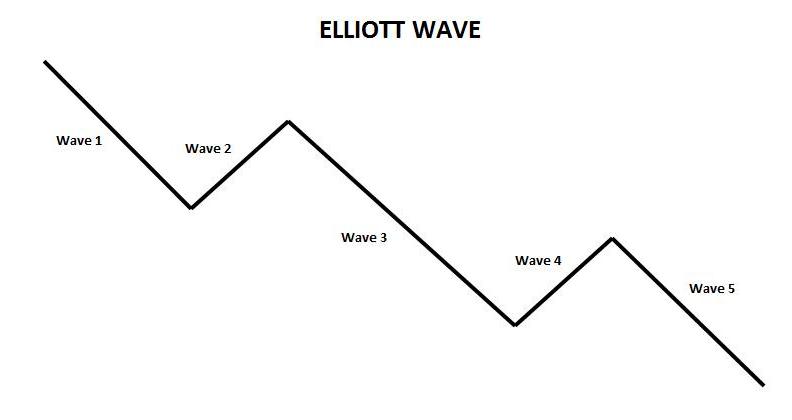
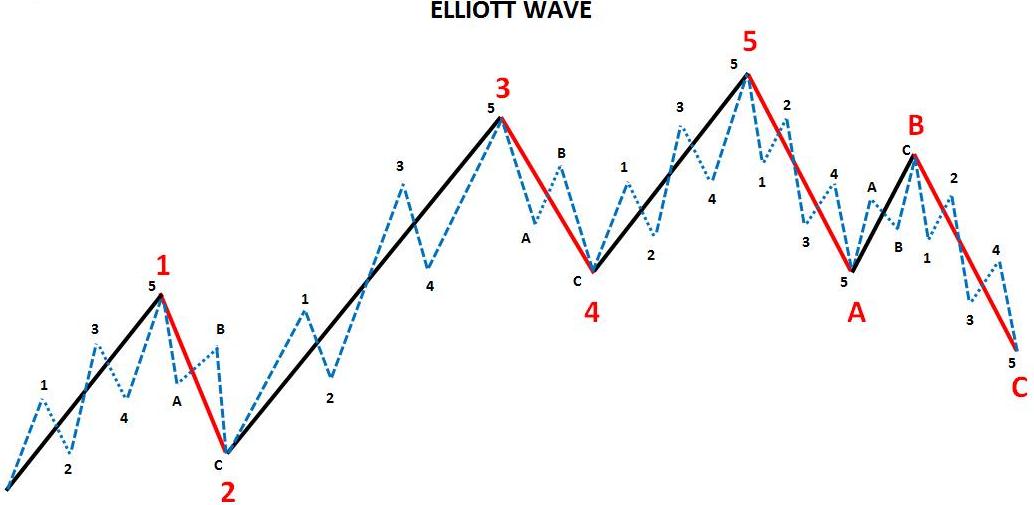
Many books have been written on Elliott’s theory so the purpose of this article is to cover the basics. The market’s progression unfolds in waves of which there are two modes, motive and corrective. The motive phase consists of five waves as is demonstrated in the charts below of Elliott Wave structure in a rising market and falling market. In a rising market the waves should fulfil the following characteristics and the same principles apply in a falling market.
Trading Commodities Online: Elliott Wave Theory
Trading Commodities Online: Elliott Wave Theory. View charts in interactive mode at ProRealTime.com.
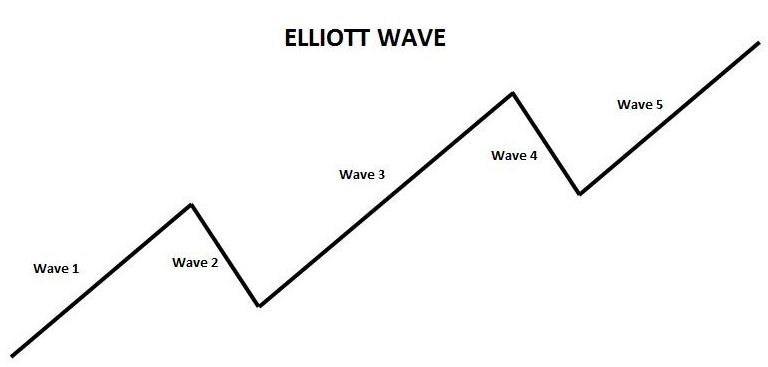
Motive Phase:
Wave 1 has no required price range to achieve and is difficult to recognise because it is only the first stage of the overall advance. However, the move itself should be noteworthy. For example, it may break a previous significant swing high that had formed before the current rally.
Wave 2 is a corrective wave against the primary trend. It cannot break the low of the start of Wave 1. In other words, it should retrace less than 100% of the previous advance. Ideally, traders like to see lower volume during the corrective phase.
Wave 3 is a resumption of the main trend, is often the longest and never the shortest of the three upward waves. It has to break the high made by Wave 1 and advance to higher prices. Again, traders going long would like to see an increase in volume during the rally.
Wave 4 is a corrective wave of the advance made by Wave 3. It should not retrace into the price region made by Wave 1.
Wave 5 is a resumption of the main upward trend again. The length of this wave can be longer or shorter than the previous wave but should break the previous high of Wave 3 and advance to higher prices.
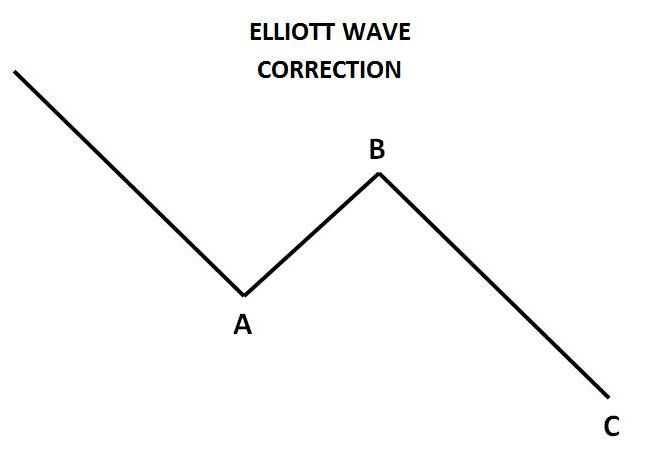
Corrective Phase:
The corrective phase is composed
of three waves that move against the primary trend. If the primary trend is
bullish it will be a downward move. In a bearish market it will be an upward
move.
Wave A is a retracement into Wave 5. Traders will find it difficult to identify it as an A wave because it could just be a correction before continuing to higher prices.
WAVE B is a rally but cannot break the high of Wave 5.
WAVE C continues the downward direction and is likely to exceed the range of Wave A. It should break the lows of Wave A and ideally traders would like to see an increase in volume during this sell off.
Trading Commodities Online: Elliott Wave Theory
Users of Elliott analysis may differ on how they interpret market action but there are three rules that must be fulfilled in order to qualify as an Elliott Wave. Wave 2 cannot break the low of Wave 1. Wave 3 cannot be the shortest of the three upward waves. Wave 4 cannot retrace into Wave 1.
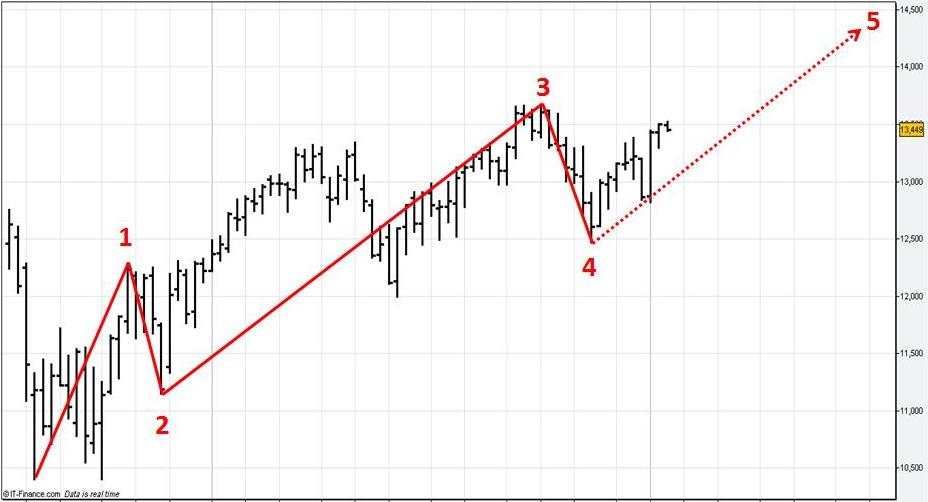
Below is a weekly bar chart of the Dow Jones Industrial Averages . It is one possible way of interpreting the market action through the use of Elliott Wave analysis. It fulfils all the rules of the theory and so it is reasonable to forecast higher prices as signified by Wave 5. Followers of Elliott theory may well go long in an attempt to profit from any rise in prices. However, as with all analysis, there are no guarantees so an effective risk management and stop loss strategy should be employed. Traders may well use other technical indicators along with Elliott Wave in their trading strategy. For example, they may use RSI, Stochastic, Williams %R or Fibonacci Retracements to pinpoint buying opportunities following a retracement in anticipation of a resumption of the uptrend. Furthermore, traders may use Measured Moves or Swing Trading to forecast the length of upward impulse waves.
Trading Commodities Online: Elliott Wave Theory
Another important aspect of Elliott Wave is its fractal nature. Fractals are mathematical structures, which repeat themselves infinitely on an ever-smaller scale. This means that a motive wave subdivides into 5 smaller waves and a corrective wave subdivides into three smaller waves. The next chart is a graphical representation of this phenomenon.
Trading Commodities Online: Elliott Wave Theory
Elliott named nine degrees of waves as best he could with the data available at the time:
- Grand Supercycle: Multi-century
- Supercycle: Multi-decade
- Cycle: One to several years or perhaps decades.
- Primary: A few months to a few years.
- Intermediate: A few weeks to a few months.
- Minor: Weeks
- Minute: Days
- Minuette: Hours
- Sub-minuette: Minutes
Elliott Wave is still widely used almost 80 years after its development. As a method of analysis it can be an excellent guide to forecasting future price direction. As with all analysis, however, once the market action ceases to conform to your interpretation, your analysis must change.
Return to Top of Trading Commodities Online: Elliott Wave Theory