Triangles
Stock Charts Technical Analysis
Stock Charts Technical Analysis – Triangles: Triangles are classified into Symmetrical Triangles, Descending Triangles and Ascending Triangles.
A Symmetrical Triangle usually forms as a continuation pattern. For example, the market has been an upward trend with high volume and then begins to congest into a triangle pattern. The triangle forms when the market has at least two lower highs and two higher lows. When the highs and lows are joined by a line they form a symmetrical triangle. So it starts off wide, converges and volume begins to decrease until the market breaks out in one direction or another. Often the pattern can last for three months or more. Anything less than three or 4 weeks would be known as a pennant. In addition, a pennant has a flagpole. To qualify as a continuation pattern the market should continue upwards.
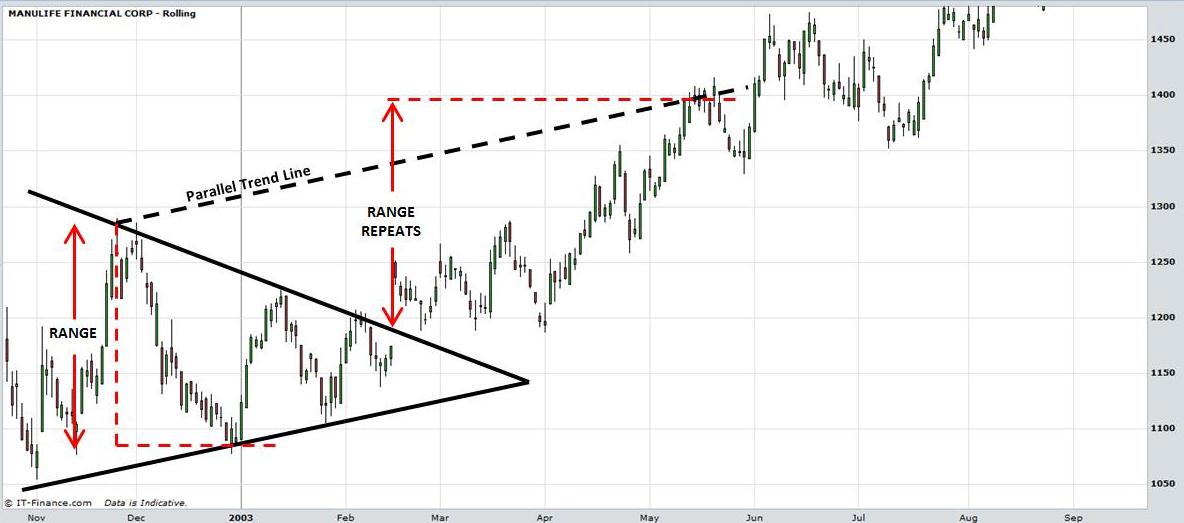
- The daily candlestick chart of Manulife Financial Corporation below demonstrates a Symmetrical Triangle.
- The market made a low on 1st November 2002 and two successively higher lows on 30th December 2002 and 28th Jan 2003. A high was made on 25th November 2002 and two successively lower highs on 14th January and 5th February 2003.
- The range is calculated as the widest part of the triangle which is the high of 25th November (1289) to the low of 30th December (1078) which is 211 points.
- The market gapped up on 14th February, opening up at 1251.
- Normally traders would be looking for the market to cross the downward sloping line before entering a long trade. However, they may decide not to enter the trade because the gap was so large and entering at this level would require greater risk because a stop loss would typically be placed somewhere under the upward trending line. Alternatively, they may wait to see whether the market fills the gap and enter at a lower price.
- Often the market does return to the downward sloping trend line before advancing again.
- To estimate a target, add the previous range of 211 points to the cross section of the date of breakout and the downward sloping trend line. 1174 + 211 points = 1385.
- The market reached 1385 on 12th May 2003.
- Another method of estimating a target is to draw a line parallel with the upward sloping trend line from the first high.
Stock Charts Technical Analysis - Triangles: View chart in interactive mode at ProRealTime.com.
Ascending Triangles are a bullish pattern that usually occurs in the middle of an uptrend.
The pattern forms with two or more equal highs and at least two higher lows. The highs are connected with a horizontal line and the lows are connected with an upward sloping line. If the lines were to be extended they would form a right angled triangle.
To form a continuation pattern then, the market should have been in a previous upward trend before meeting resistance at the level of the horizontal line. However, the lows continue to grind higher thereby forming an upward sloping line. So although volume may decrease during this congestion period, the fact that the market is making higher lows is an indication that there is buying interest and traders are accumulating periods. Eventually the market breaks to higher levels. This pattern can last for a few weeks to months.
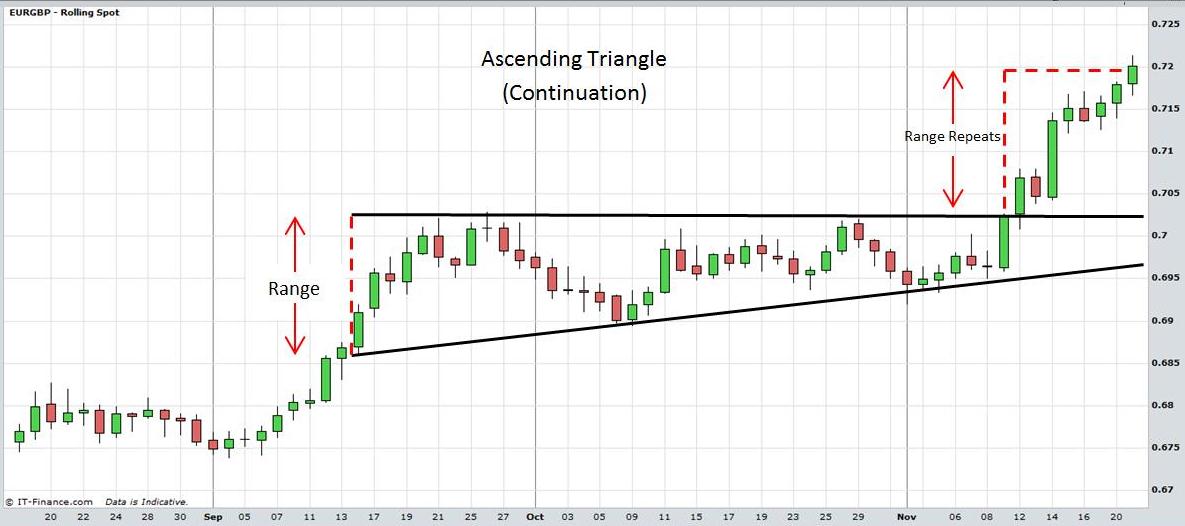
- In the next chart of the EUR/GBP the market was in an upward trend until it reached resistance around the 0.7020 level on 21st September, 26th September and 29th October 2007. The lows, however, continue to move higher, forming an upward trend line.
- The market breaks above the resistance line on 12th November 2007.
- Traders may go long on this day. Others may wait for a 2 or 3 day confirmation close above resistance. Alternatively, traders may wait for the market to rise a certain percentage above the horizontal line e.g. 3% before entering a trade.
- To estimate a target, add the range from the widest part of the triangle and add it to the horizontal resistance line.
- In this case, subtract the low of 14th September (0.6859) from the high of 21st September (0.7021) which gives a range of 162 pips.
- You could also use the low made on 1st November to calculate the range.
- Add 162 pips to (0.7021) to give a target of 0.7183.
- The market reached this target on 20th November 2007.
Stock Charts Technical Analysis: Triangles
Stock Charts Technical Analysis: Triangles
Descending Triangles are a bearish pattern that usually occurs in the middle of a downtrend. The pattern forms with two or more equal lows and at least two lower highs. The lows are connected with a horizontal line and the highs are connected with a downward sloping trend line. If the lines were to be extended they would form a right angle triangle.
To form a continuation pattern then, the market needs to have been in a downward trend before meeting support at the level of the horizontal line. However, the highs continue to ease lower forming a downward sloping line. Although, volume may decrease during this period of congestion, the fact that the market is making lower highs indicates that there may be selling pressure and distribution taking place. Eventually the market breaks to lower prices. This pattern can last for a few weeks to months.
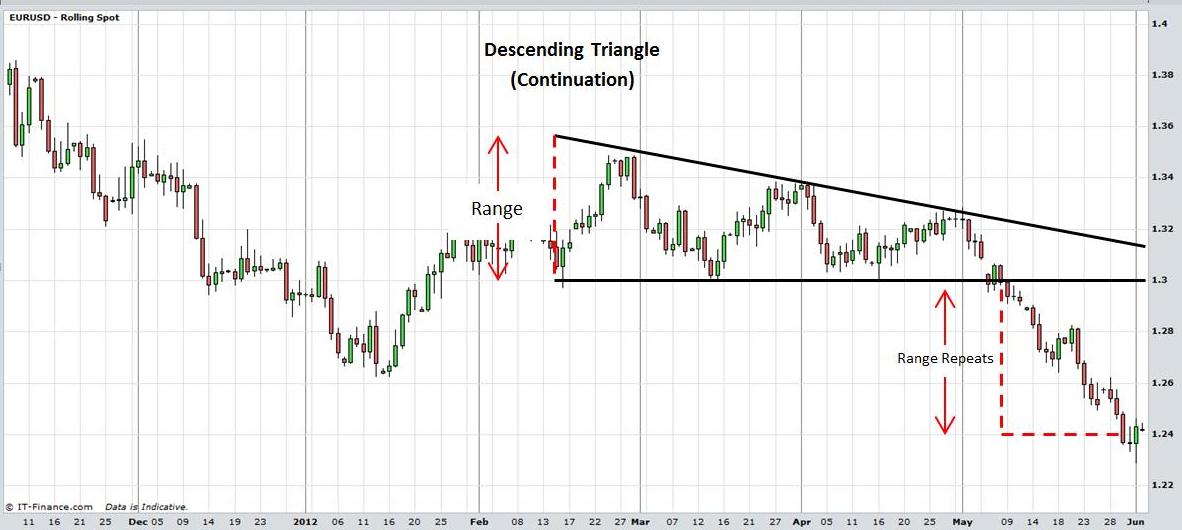
- In the chart below of the EUR/USD the market receives support around the 1.0300 level three times on 16th February 12, 14/15th March and 16th April 2012.
- Consecutive lower highs are made on 29th February, 2nd April and 1st May 12.
- Finally, on 9th May the market breaks through the support line to lower prices.
- Calculate the range by subtracting the lower price (1.0300) from the highest price made on 16th February (1.3487) to get a range of 487 pips.
- To estimate a target for the market to reach, subtract 487 pips from 1.0300 to give a price of 1.2513.
- EUR/USD reached this price on 25th May 2012.
Stock Charts Technical Analysis: Triangles
Stock Charts Technical Analysis - Triangles: View chart in interactive mode at ProRealTime.com.
Triangles can manifest in Stocks, Exchange Traded Funds, Forex,
Commodities, Bonds, Futures, etc.
Return to Top of Stock Charts Technical Analysis: Triangles
Return to Technical Analysis Charts