Futures Trading How To
Pivot Points
Futures TradingHow To: Pivot points use the previous day’s high, low and close prices to calculate important support and resistance levels for the next day. Originally it was a popular technique used by professional day traders on the floors of futures exchanges. Today, most charting packages offer them as a technical analysis trading tool. Typically it is used for day trading but can also be applied to longer time frames.
There are different ways to use pivot points but the most common way to calculate the next day’s levels are:
- Pivot Point (PP) = (Yesterday’s High + Yesterday’s Low + Yesterday’s Close)/3
- Support 1 (S1) = (PP * 2) – Yesterday’s High
- Support 2 (S2) = PP - (Yesterday’s High – Yesterday’s Low)
- Support 3 (S3) = (2 * PP) – ((2 * Yesterday’s High) – Yesterday’s Low)
- Resistance 1 (R1) = (PP * 2) – Yesterdays Low
- Resistance 2 (R2) = PP + (Yesterday’s High – Yesterday’s Low)
- Resistance 3 (R3) = (2 * PP) + (Yesterday’s High – (2 * Yesterday’s Low)
Once the pivot point levels are set for the next day they don’t change. They are displayed as lines overlaid on the days price action so it is clear to see whether they are working on any given day. It is important to understand the concepts of support and resistance in order to trade with the pivot points. They are leading indicators so traders used them as predictors of future price behaviour.
The Pivot Point (PP) is the main price level to watch first. If the markets open above or below the PP traders may watch for the markets to trade back to the PP and may trade long or short into it. If the market trades above the PP traders may look to R1 as the first resistance level. As a resistance level is broken it signifies strength and the new target is the next resistance level. Similarly, when the market trades below the PP, traders may go short and expect initial support at the S1 level. As a support level is broken it signifies weakness and the new target is the next support level.
It is important to note that just because a market has been trading down through the support levels doesn’t mean it won’t rally above the PP later. The same applies to a market rallying above the PP level. Intra-day price action can be very volatile and prices may reach both resistance and support levels on the same day. Furthermore, traders should not expect markets to turn exactly on these levels. Markets may become volatile for a period around support or resistance before eventually reversing, breaking through or settling around the level itself. Pivot points should be used as a guide, providing a possible roadmap for the day’s price action. Traders should adapt their trading strategy to this volatility and implement an appropriate risk management and stop loss strategy.
Individual traders will interpret pivot points to suit their own approach. For example, one trader may go long when the market breaks through the PP to the upside and sell when the market reaches R1. Another may wait for the market to reach R1 or R2 and sell expecting a reaction to the downside. It is common to use other indicators such as a momentum oscillator like the RSI, Stochastic or Williams %R in combination with pivot points. For example, if prices reach R2 or R3 and the oscillator indicates overbought conditions, traders may sell in anticipation of a pull back. On the other hand, if prices trade down to the S2 or S3 level and the oscillator indicates oversold conditions a trader may buy in anticipation of a rally.
New traders should spend some time studying the intra-day action of the financial security they wish to trade. Markets can trade relatively quietly for a number of days and suddenly explode to the upside or downside with tremendous speed. Intra-day volatility provides opportunities for traders familiar with the market but is high risk and needs to be managed properly. Pivot points can be a useful tool in managing this risk.
Look at the 15 minute bar chart of the Dow Jones futures markets below. Notice how the market often reacts around support and resistance levels. On the 27th November 2012 the market traded up to R1, failed to break through, declined to S2 where it received support and closed at that level. The next day on the 28th November, prices declined rapidly to the S2 level. This is an example of the intra-day volatility and how the pivot points are a guideline rather than an exact turning point. The market broke through the S2 level briefly before closing back on it and rallying strongly from that level. It reacted off the PP level before eventually breaking through to R1, around which prices fluctuated for some time. On the 29th November prices rallied to the R1 level before declining and could not break through to higher levels. Similarly on the 30th November, the market rallied to the R1 level before declining back to the PP.
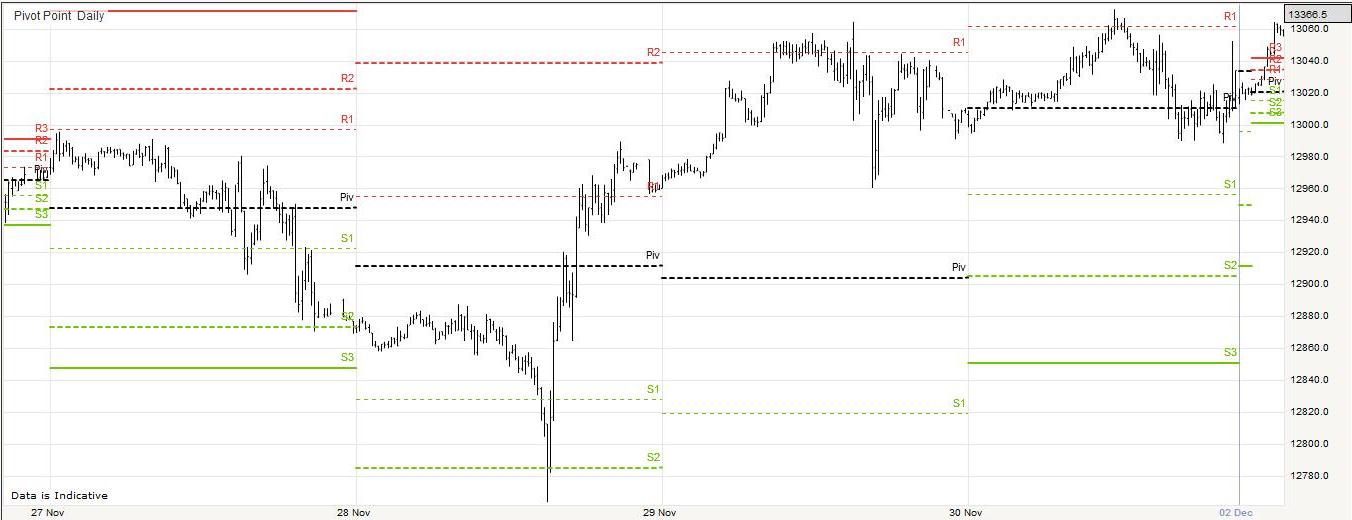
Futures Trading How To: Pivot Points. View charts in interactive mode at ProRealTime.com.
The next futures trading how to chart is a 15 minute bar
chart of the S&P500 from 11th to 14th December 2012. Observe
how the market reacts around the pivot points and associated support and resistance
levels.
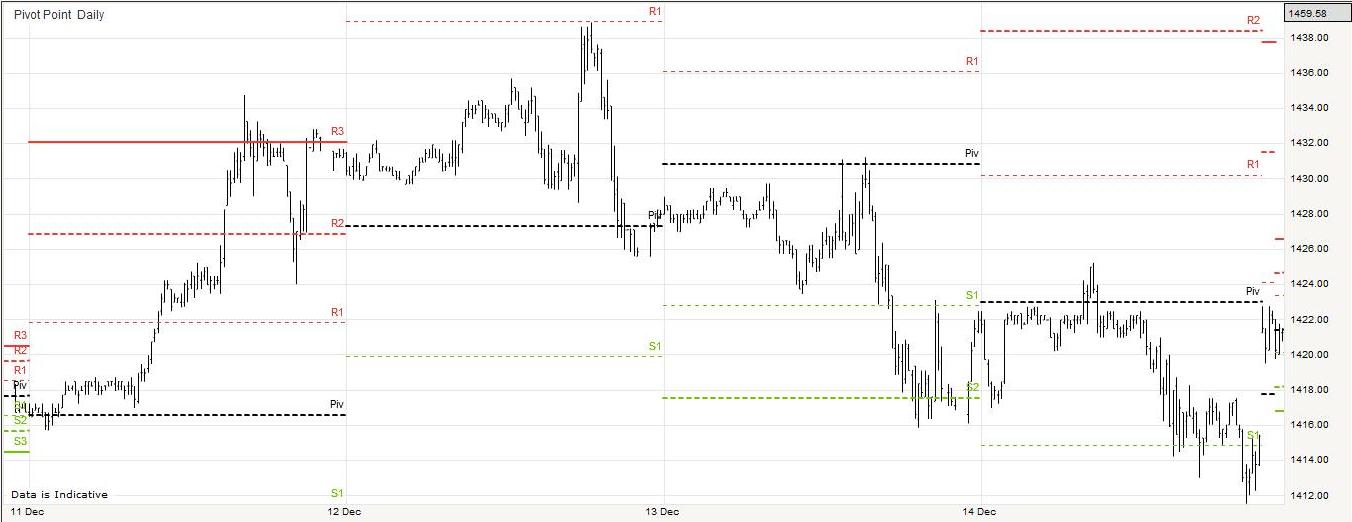
Futures Trading How To: Pivot Points. View charts in interactive mode at ProRealTime.com.
Futures Trading How To Futures Trading How To
The method explained above is the most common way to use pivot points. Alternative systems exist. For example, some use Fibonacci calculations to calculate the support and resistance levels. The same pivot point is used but the Fibonacci levels of 38.2%, 61.8% and 100% are added to the PP to get the resistance levels or subtracted to get the support levels.
Trendlines can be used in trading Stocks, Exchange Traded Funds, Forex, Commodities, Bonds, Futures, etc.
Return to Top of Futures Trading How To: Pivot Points